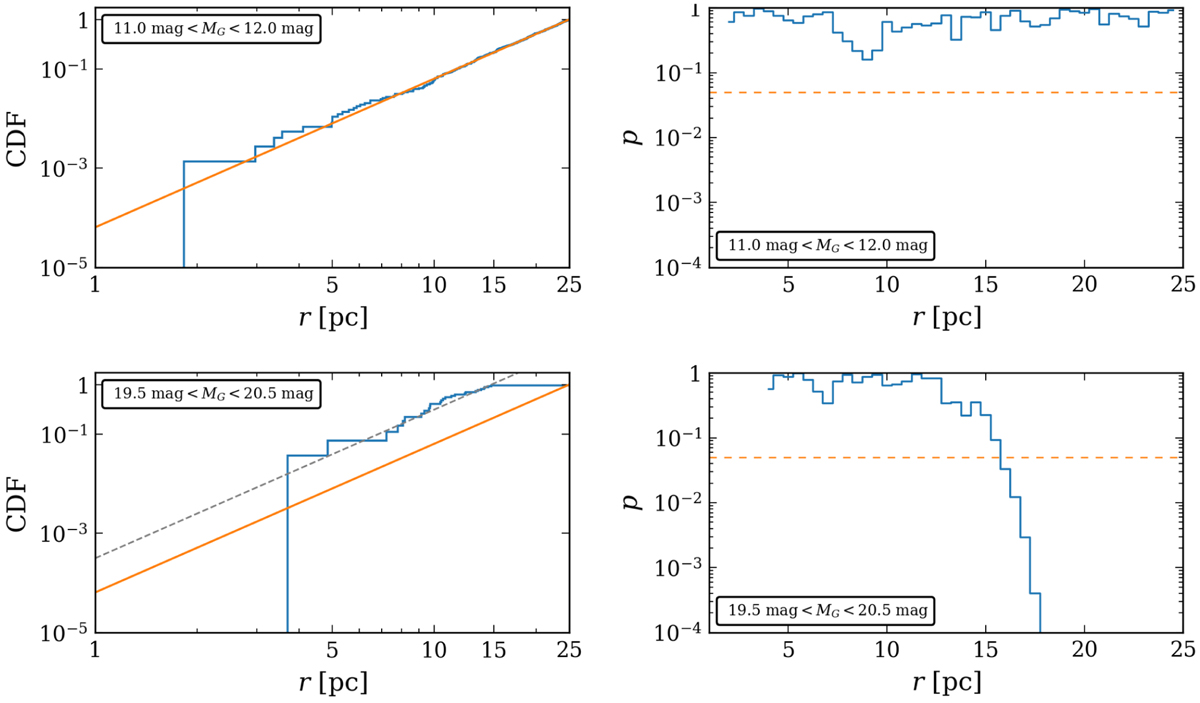
Fig. 7
Download original image
We illustrate how we estimate the completeness limit with the help of the Kolmogorov-Smirnov test. Left column: empirical (shown in blue) and analytical (shown in orange) CDFs. Right column: p value from the Kolmogorov-Smirnov test as a function of probed distance limit. The dashed line indicates the p = 0.05 threshold. Values below the threshold indicate that the empirical and analytical CDFs are significantly different, which means that the spatial distribution of objects in the subsample is not uniform anymore. Thus, the subsample cannot be regarded as statistically complete beyond the completeness radius. Two magnitude ranges are shown here as an example. The dashed line in the lower left panel denotes the re-normalised CDF using the derived completeness limit for this magnitude bin.
Current usage metrics show cumulative count of Article Views (full-text article views including HTML views, PDF and ePub downloads, according to the available data) and Abstracts Views on Vision4Press platform.
Data correspond to usage on the plateform after 2015. The current usage metrics is available 48-96 hours after online publication and is updated daily on week days.
Initial download of the metrics may take a while.