Fig. 5
Download original image
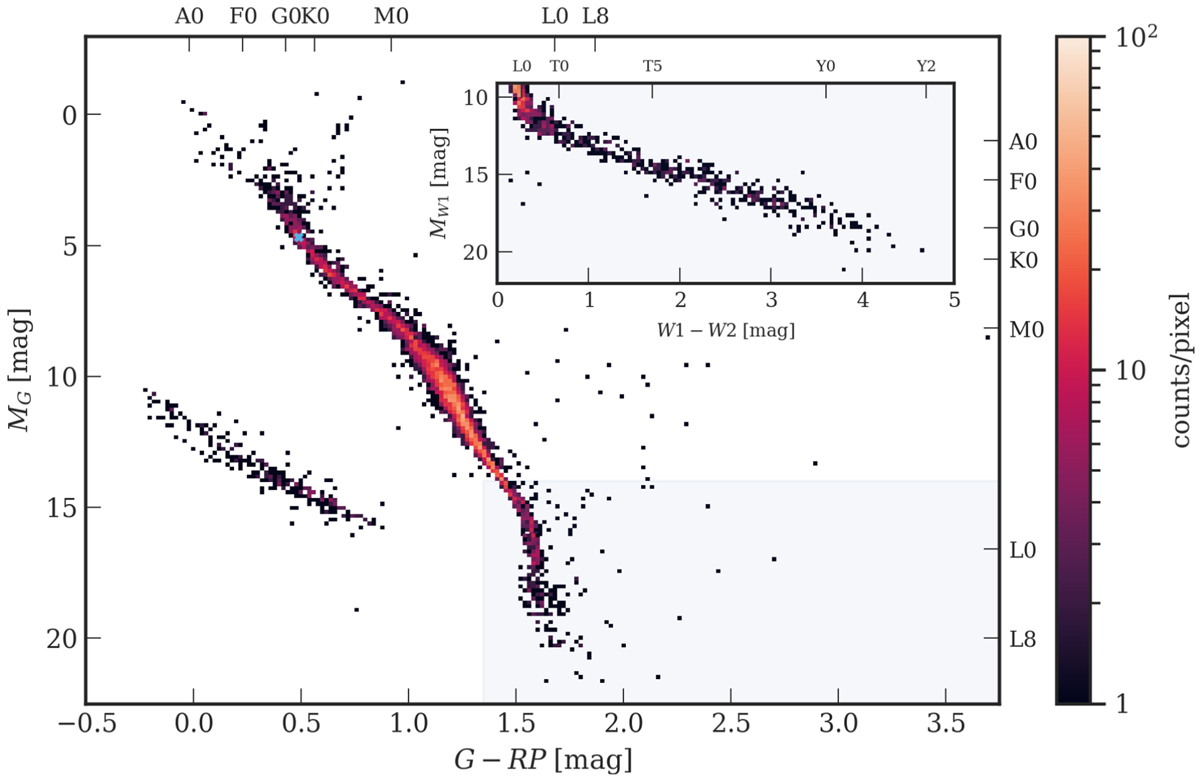
CMD of CNS5 objects in Gaia EDR3 and WISE bands. The main plot includes Gaia EDR3 objects with resulting G – RP colours. This includes objects with synthetic colours and also objects that fall out of its applicability range. It also includes objects from HIPPARCOS that do not have a counterpart in Gaia EDR3, with converted G and RP magnitudes. The top and right axes show the spectral type and the blue cross represents the Sun’s location on this CMD. The grey shaded area corresponds to the region in which the number of main-sequence objects not present in Gaia start to increase in WISE bands. Thus, this region is also represented as an inset plot in WISE bands with the spectral type on the top axis. The colour bar shows the density in terms of star counts per pixel. On the main plot, each pixel is [0.020 × 0.15] mag2 while on the inset plot it is [0.045 × 0.25] mag2. One extreme outlier falls outside of the main plot region.
Current usage metrics show cumulative count of Article Views (full-text article views including HTML views, PDF and ePub downloads, according to the available data) and Abstracts Views on Vision4Press platform.
Data correspond to usage on the plateform after 2015. The current usage metrics is available 48-96 hours after online publication and is updated daily on week days.
Initial download of the metrics may take a while.