Fig. 4
Download original image
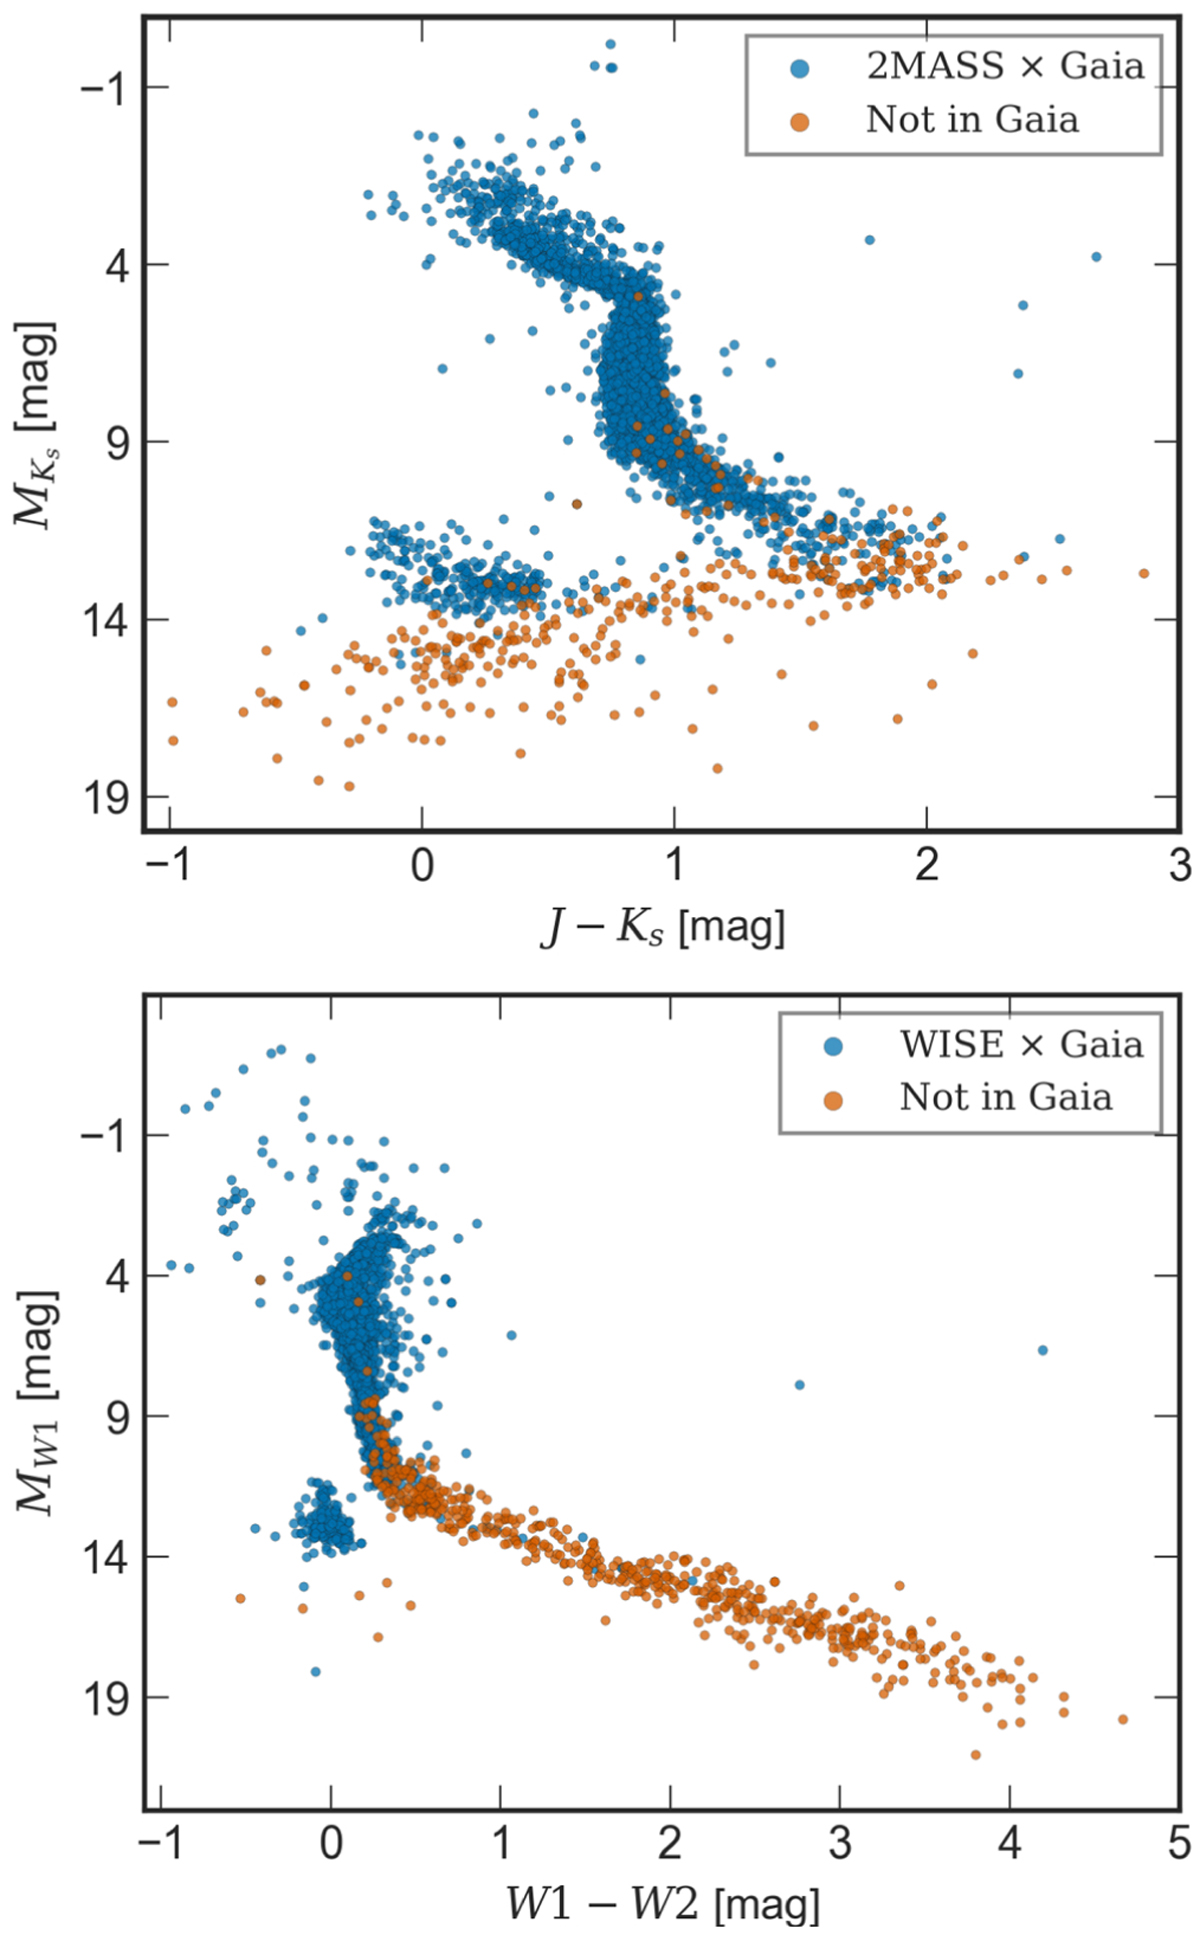
CMDs of CNS5 objects in infrared. Top: CMD of the 2MASS sample. The blue points represent 2MASS sources cross-matched with Gaia EDR3, while the orange ones are not present in Gaia. Six extreme outliers are out of this frame. Bottom: similarly, a CMD of the WISE sample, with the blue points representing WISE sources cross-matched with Gaia EDR3, while the orange ones are not present in Gaia. Two extreme outliers are out of this frame.
Current usage metrics show cumulative count of Article Views (full-text article views including HTML views, PDF and ePub downloads, according to the available data) and Abstracts Views on Vision4Press platform.
Data correspond to usage on the plateform after 2015. The current usage metrics is available 48-96 hours after online publication and is updated daily on week days.
Initial download of the metrics may take a while.