Fig. 3
Download original image
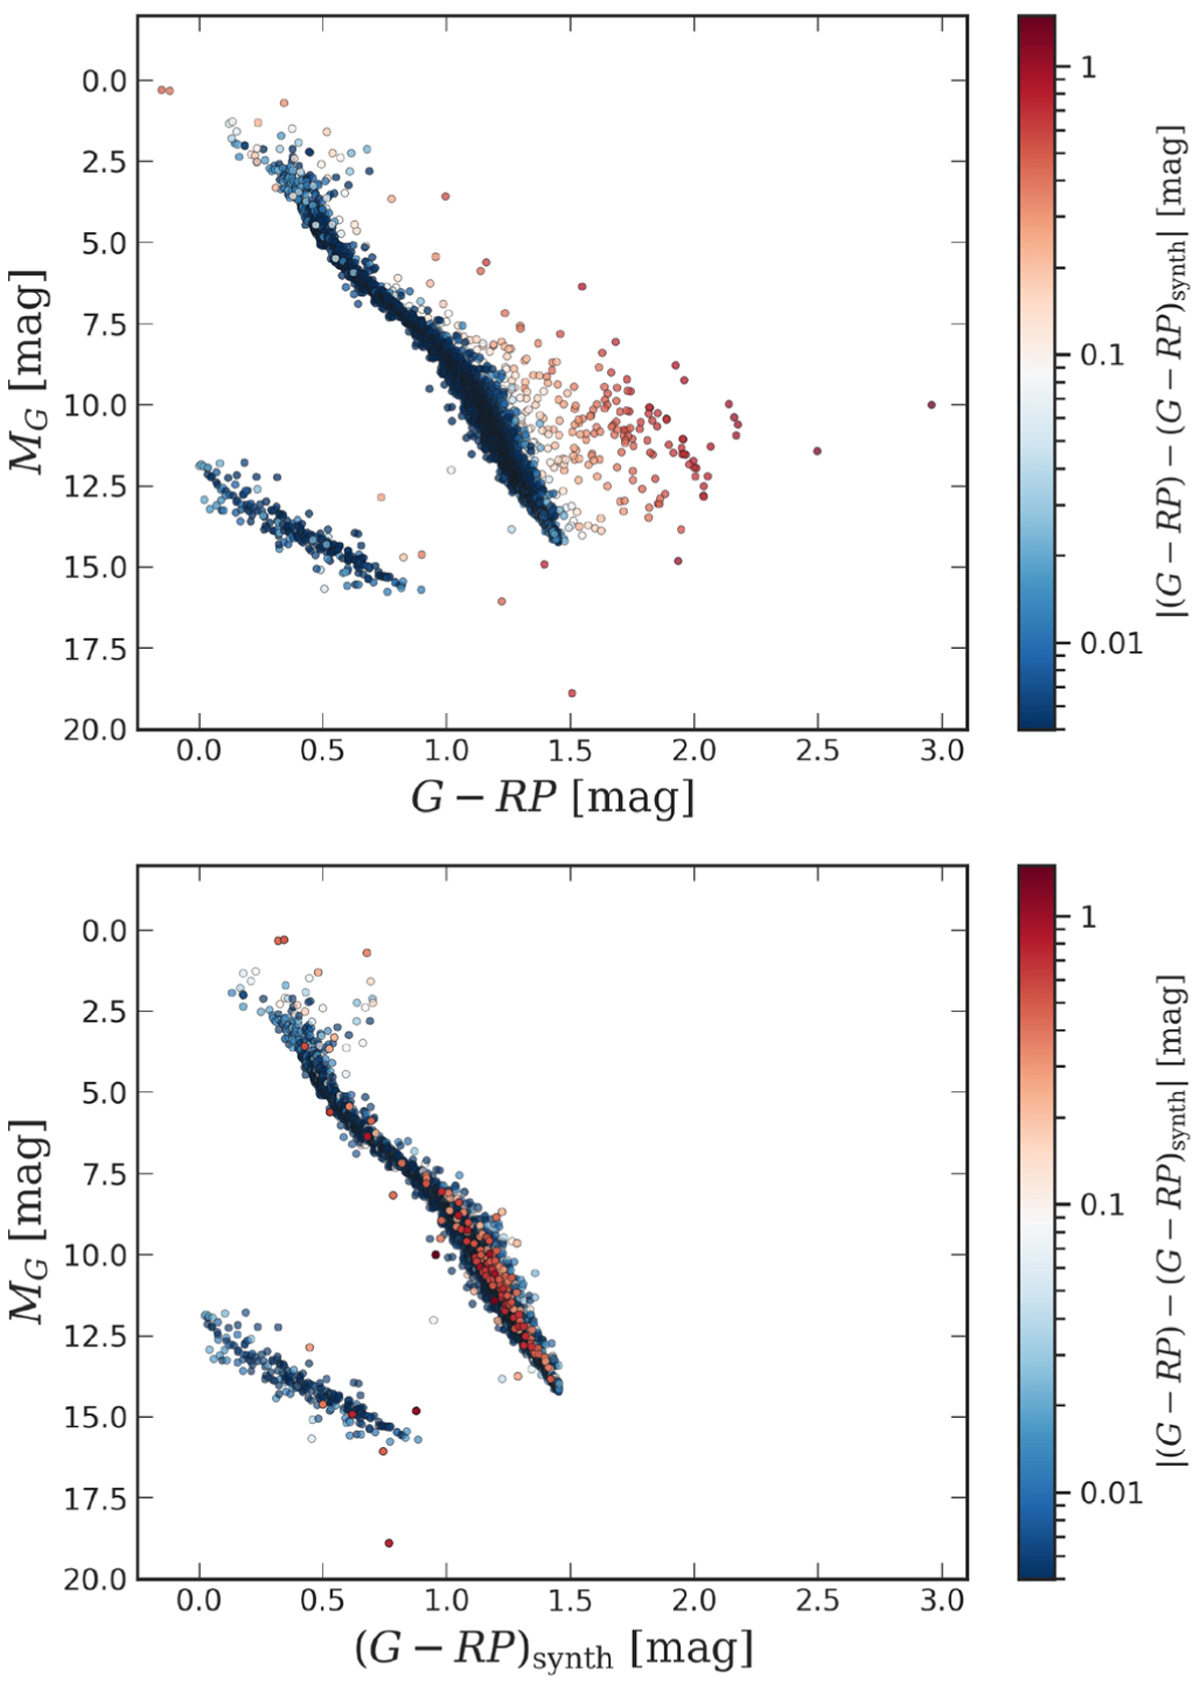
CMD for objects in the CNS5 that have a counterpart in Gaia EDR3. Top: CMD using the published G – RP colour. Bottom: CMD for the same sample, but using synthetic (deblended) G – RP colours. The colour bar shows the absolute difference between the measured and synthetic G – RP colours. The stars coded in red are the ones with the largest differences between the two colours.
Current usage metrics show cumulative count of Article Views (full-text article views including HTML views, PDF and ePub downloads, according to the available data) and Abstracts Views on Vision4Press platform.
Data correspond to usage on the plateform after 2015. The current usage metrics is available 48-96 hours after online publication and is updated daily on week days.
Initial download of the metrics may take a while.