Open Access
Fig. B.4
Download original image
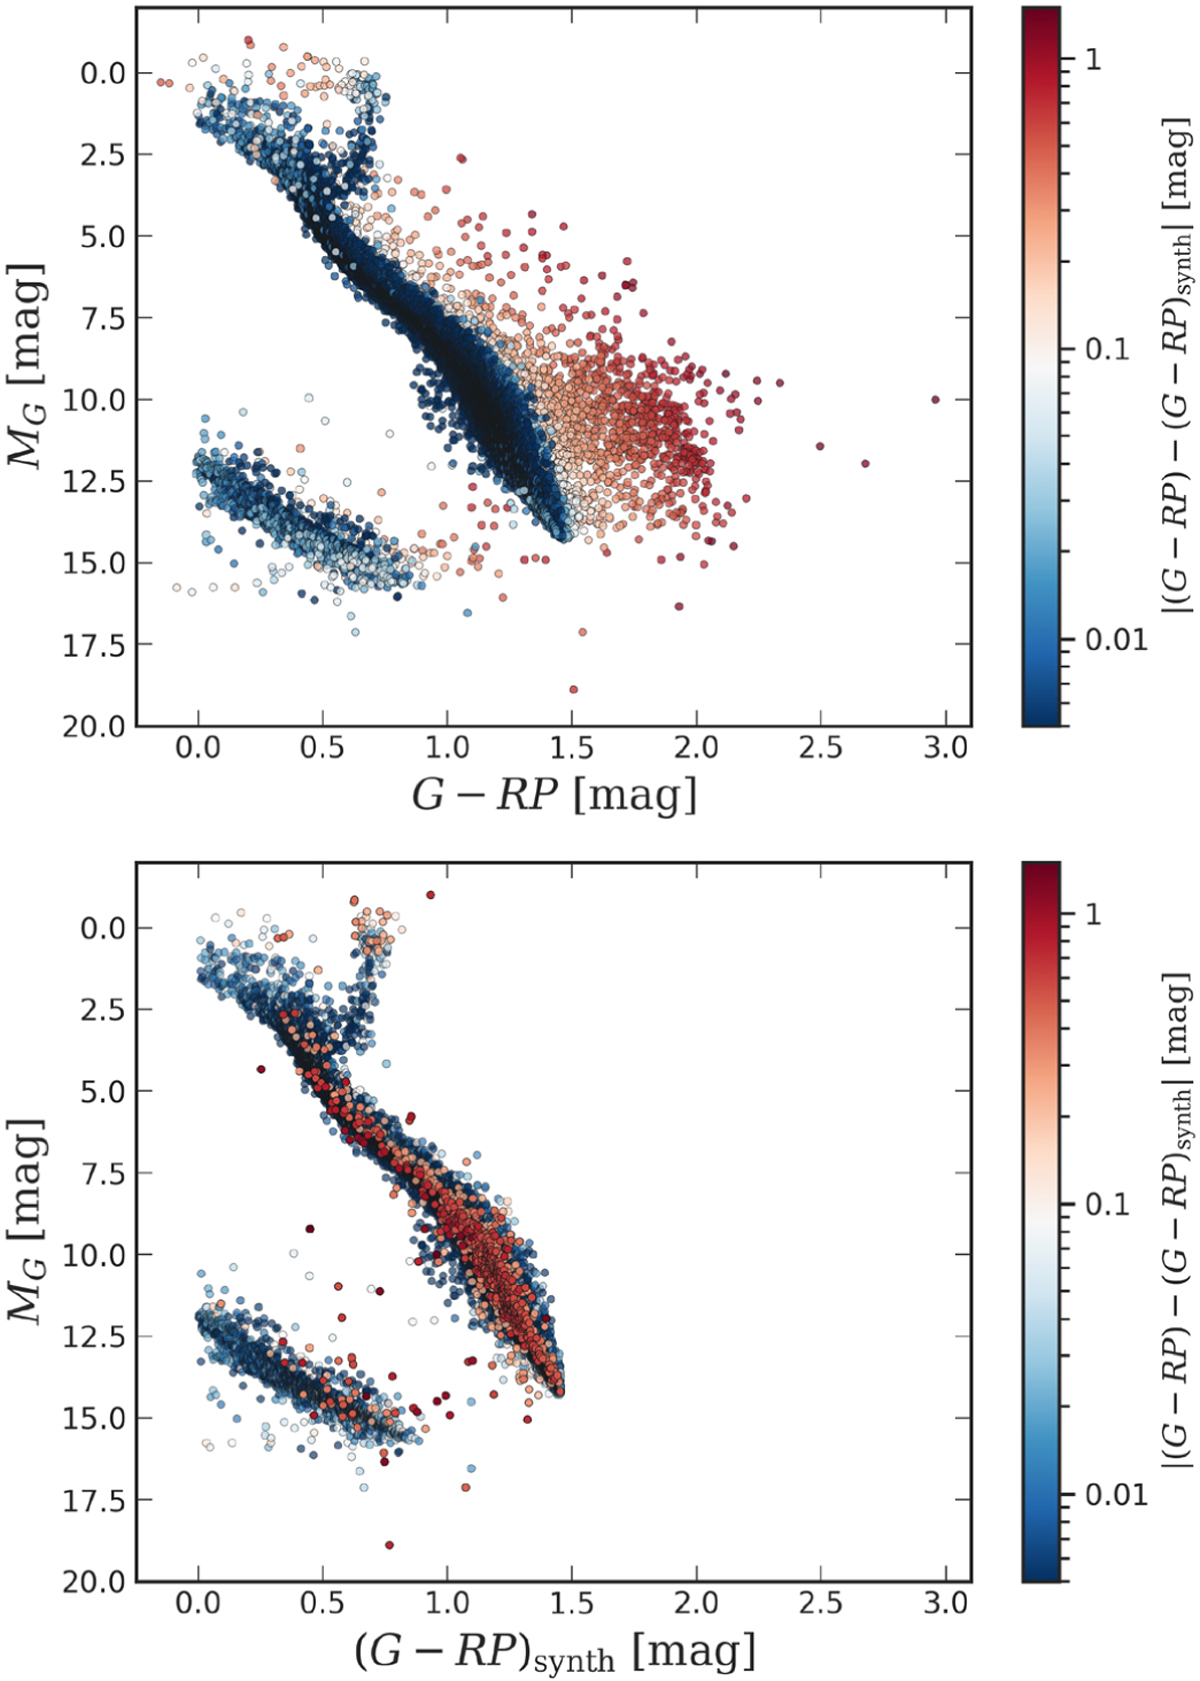
Difference between the measured and deblended G – RP colours for objects in the 50 pc sample and their location on the CMD (using measured G – RP colour). Only objects with BP – RP colours within the applicability range 0.0 mag < BP – RP < 4.25 mag are plotted. The colour scale is logarithmic.
Current usage metrics show cumulative count of Article Views (full-text article views including HTML views, PDF and ePub downloads, according to the available data) and Abstracts Views on Vision4Press platform.
Data correspond to usage on the plateform after 2015. The current usage metrics is available 48-96 hours after online publication and is updated daily on week days.
Initial download of the metrics may take a while.