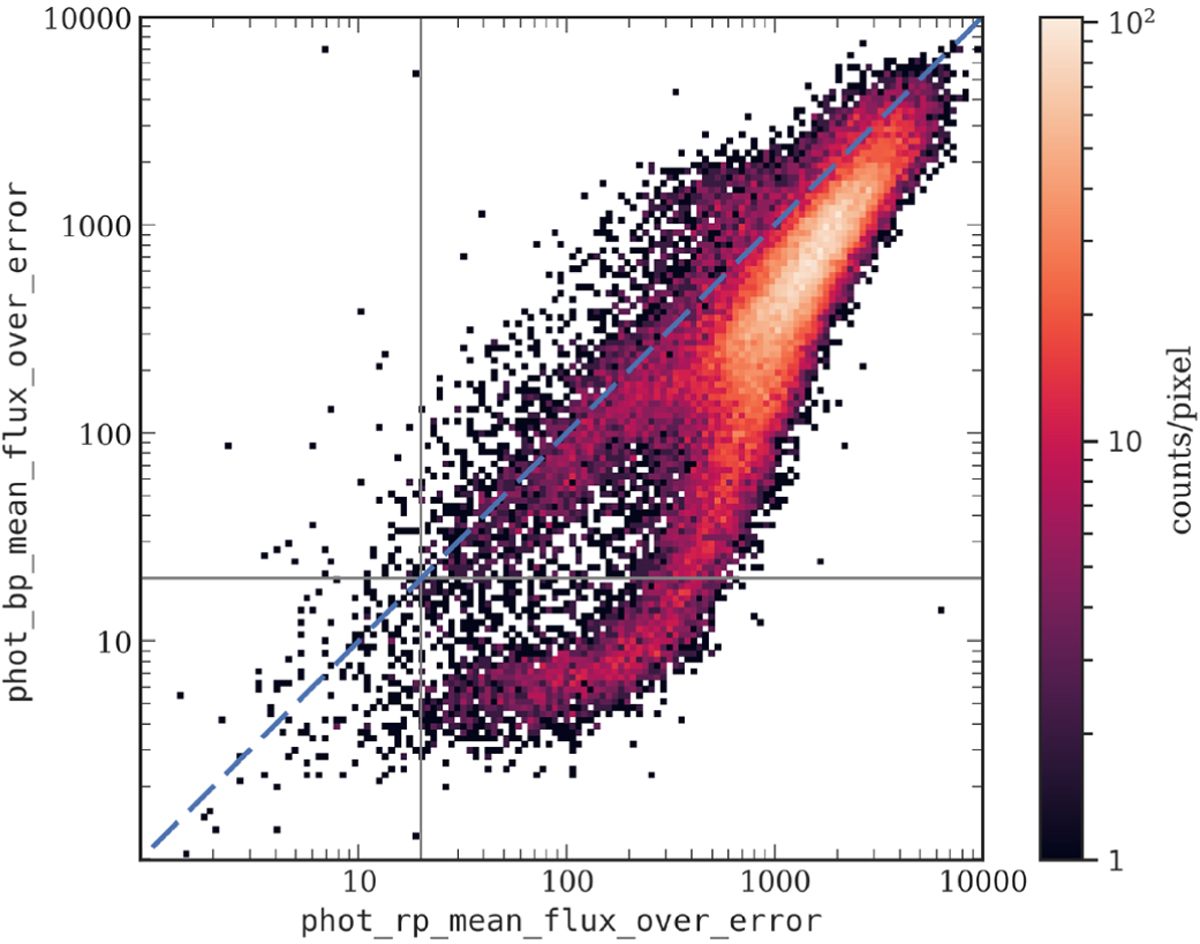
Fig. B.1
Download original image
BP and RP flux-over-error ratios for 39 873 sources in a 50 pc sample retained by Eq. (A.3). The vast majority of objects is located below the 1:1 line (blue dashed line); i.e. the S/N for these objects is higher in the RP band than in the BP band. Grey lines correspond to the S/N threshold applied in Eq. (B.2). It is noteworthy that there is a significant fraction of objects with high-S/N RP photometry, but low- S/N BP photometry (S/NBP < 20 & S/NRP > 20).
Current usage metrics show cumulative count of Article Views (full-text article views including HTML views, PDF and ePub downloads, according to the available data) and Abstracts Views on Vision4Press platform.
Data correspond to usage on the plateform after 2015. The current usage metrics is available 48-96 hours after online publication and is updated daily on week days.
Initial download of the metrics may take a while.