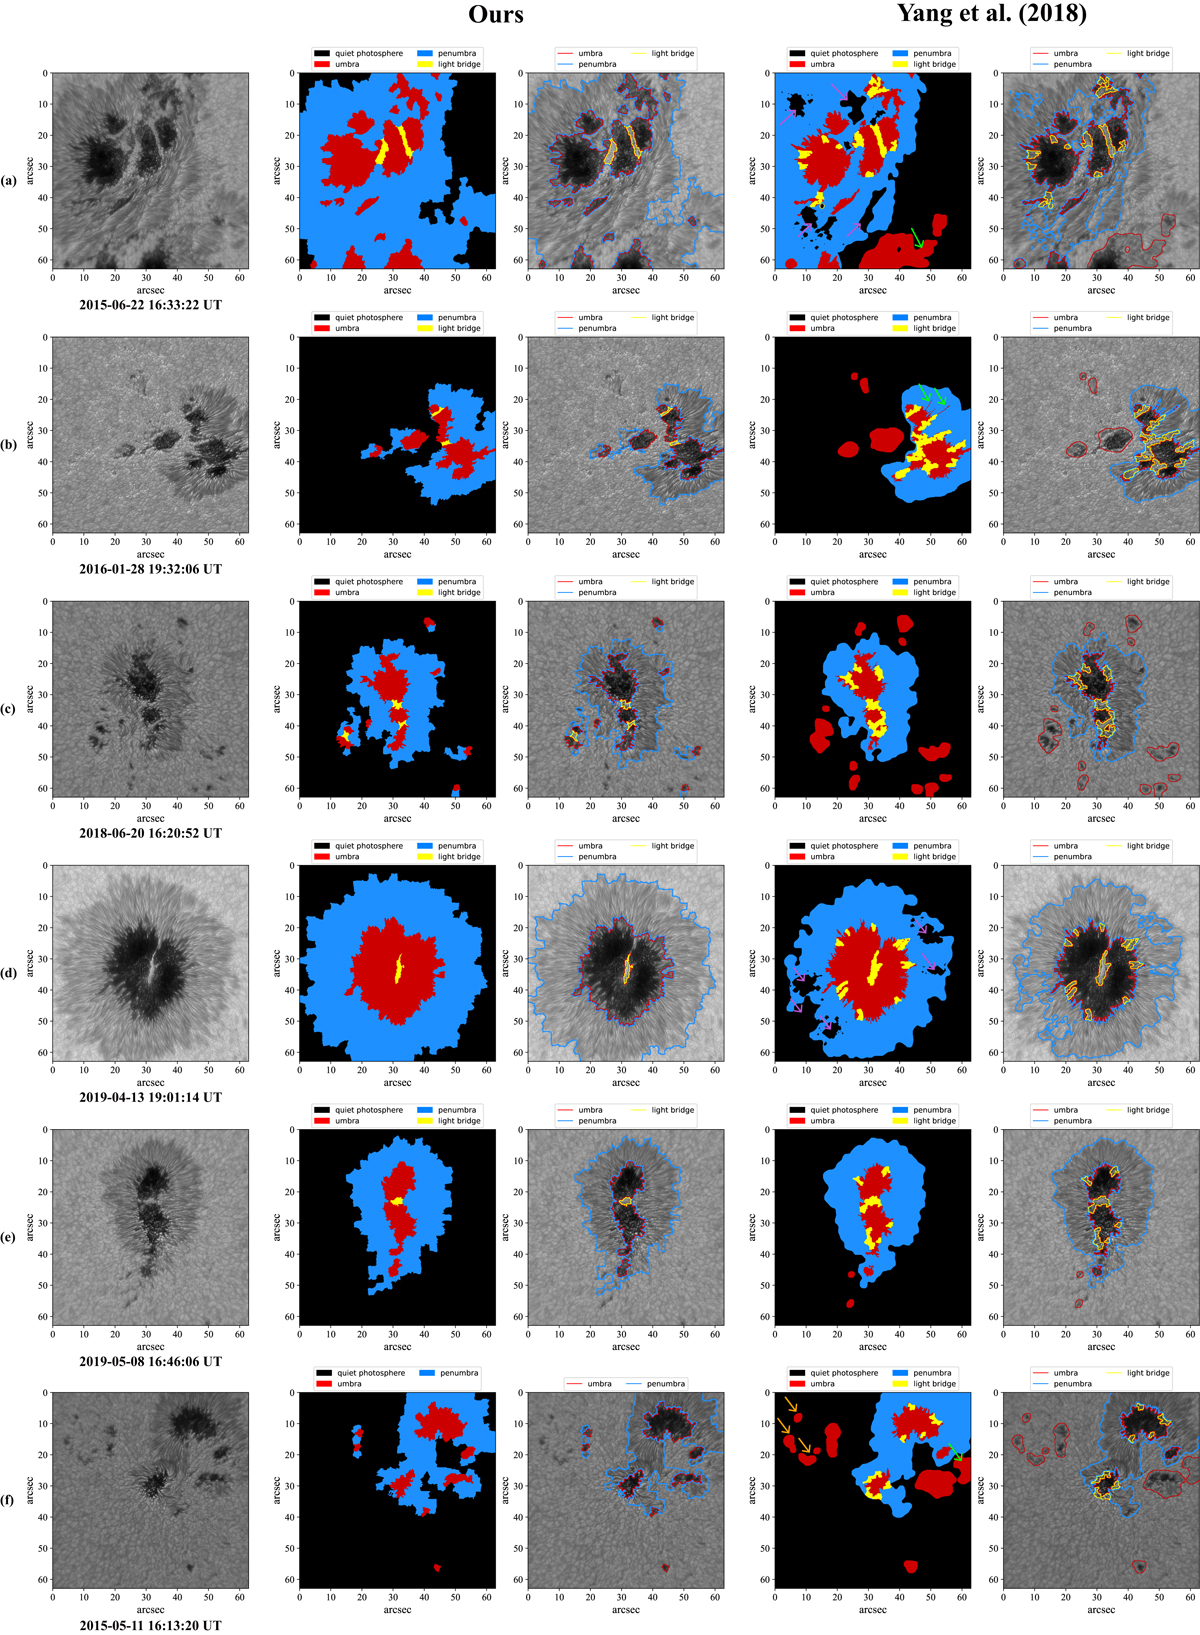
Fig. 10.
Download original image
Results of the fine-structure segmentation of our method and of that of Yang et al. (2018). In panels a–f, the first column is the input image. Columns 2–3 show the segmentation results generated by our algorithm. Columns 4–5 are the results generated by the algorithm of Yang et al. (2018). The purple arrows in the fourth column of panels a and d indicate the representative examples of the penumbra areas that are not recalled by Yang et al. (2018). The green arrows in the fourth column of panels a, b, and f indicate the representative examples of the incorrectly segmented umbra areas by Yang et al. (2018). The orange arrows in the fourth column of panel f indicate the representative examples of pores that Yang et al. (2018) could recall, but our method could not.
Current usage metrics show cumulative count of Article Views (full-text article views including HTML views, PDF and ePub downloads, according to the available data) and Abstracts Views on Vision4Press platform.
Data correspond to usage on the plateform after 2015. The current usage metrics is available 48-96 hours after online publication and is updated daily on week days.
Initial download of the metrics may take a while.