Open Access
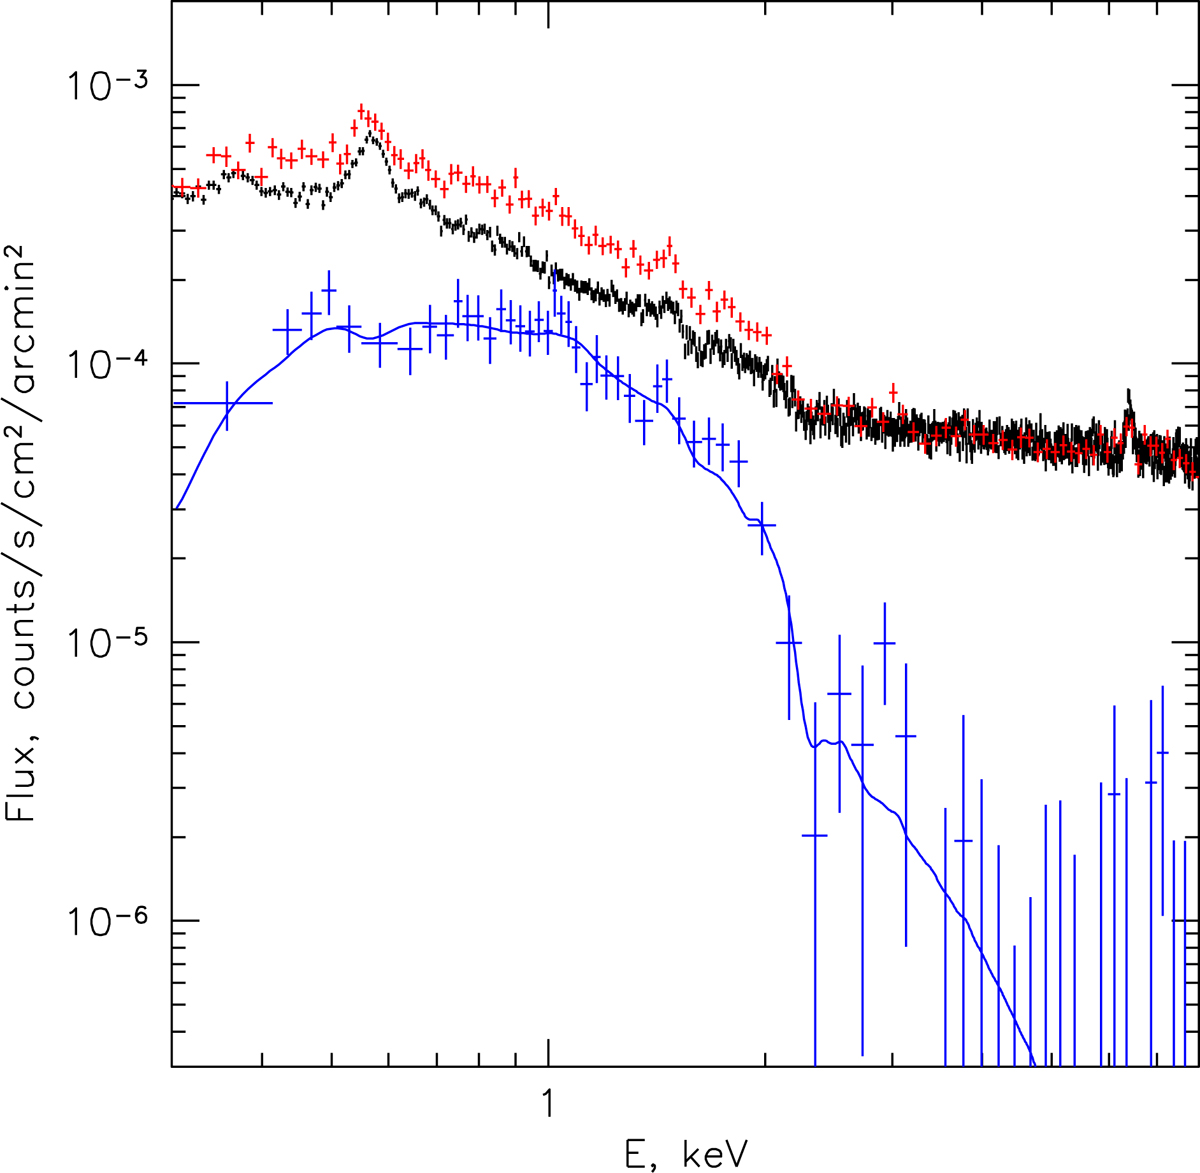
Fig. 8.
Download original image
Spectrum of the excess emission in the relic region (blue). This emission was calculated as the difference of the spectrum in the relic wedge between 70 and 80 arcmin (red) and the spectrum in the same radial bin but in a wider wedge 0−270° (black). The APEC fit to the relic emission is shown with a blue curve.
Current usage metrics show cumulative count of Article Views (full-text article views including HTML views, PDF and ePub downloads, according to the available data) and Abstracts Views on Vision4Press platform.
Data correspond to usage on the plateform after 2015. The current usage metrics is available 48-96 hours after online publication and is updated daily on week days.
Initial download of the metrics may take a while.