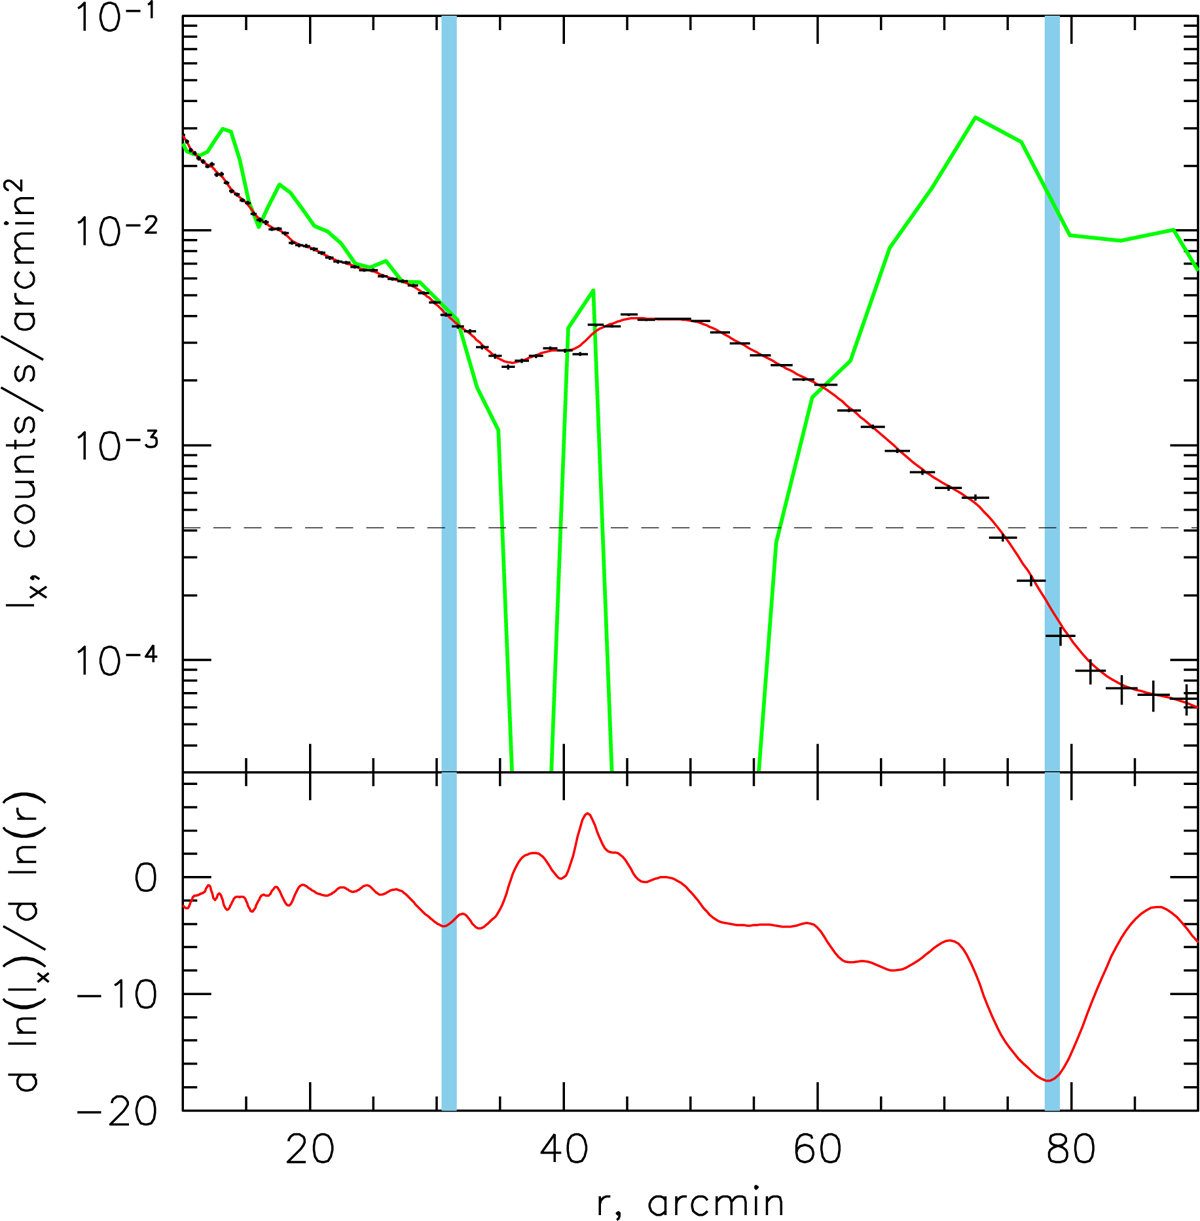
Fig. 5.
Download original image
Comparison of X-ray and radio radial profiles in the relic wedge. Top panel: X-ray surface brightness profile in the 0.4−2.3 keV band (black points). The red line shows the interpolated profile. For comparison, the green line shows the WSRT profile in the same wedge extracted from the 325 MHz image of Brown & Rudnick (2011). The radio profile was renormalized to match the X-ray profile in the Coma core. Bottom panel: logarithmic derivative of the interpolated X-ray surface brightness profile. Two regions with the steepest negative gradients are marked with blue vertical lines. The inner line corresponds to the 30′-shock, while the outer one – to the relic.
Current usage metrics show cumulative count of Article Views (full-text article views including HTML views, PDF and ePub downloads, according to the available data) and Abstracts Views on Vision4Press platform.
Data correspond to usage on the plateform after 2015. The current usage metrics is available 48-96 hours after online publication and is updated daily on week days.
Initial download of the metrics may take a while.