Fig. A.1.
Download original image
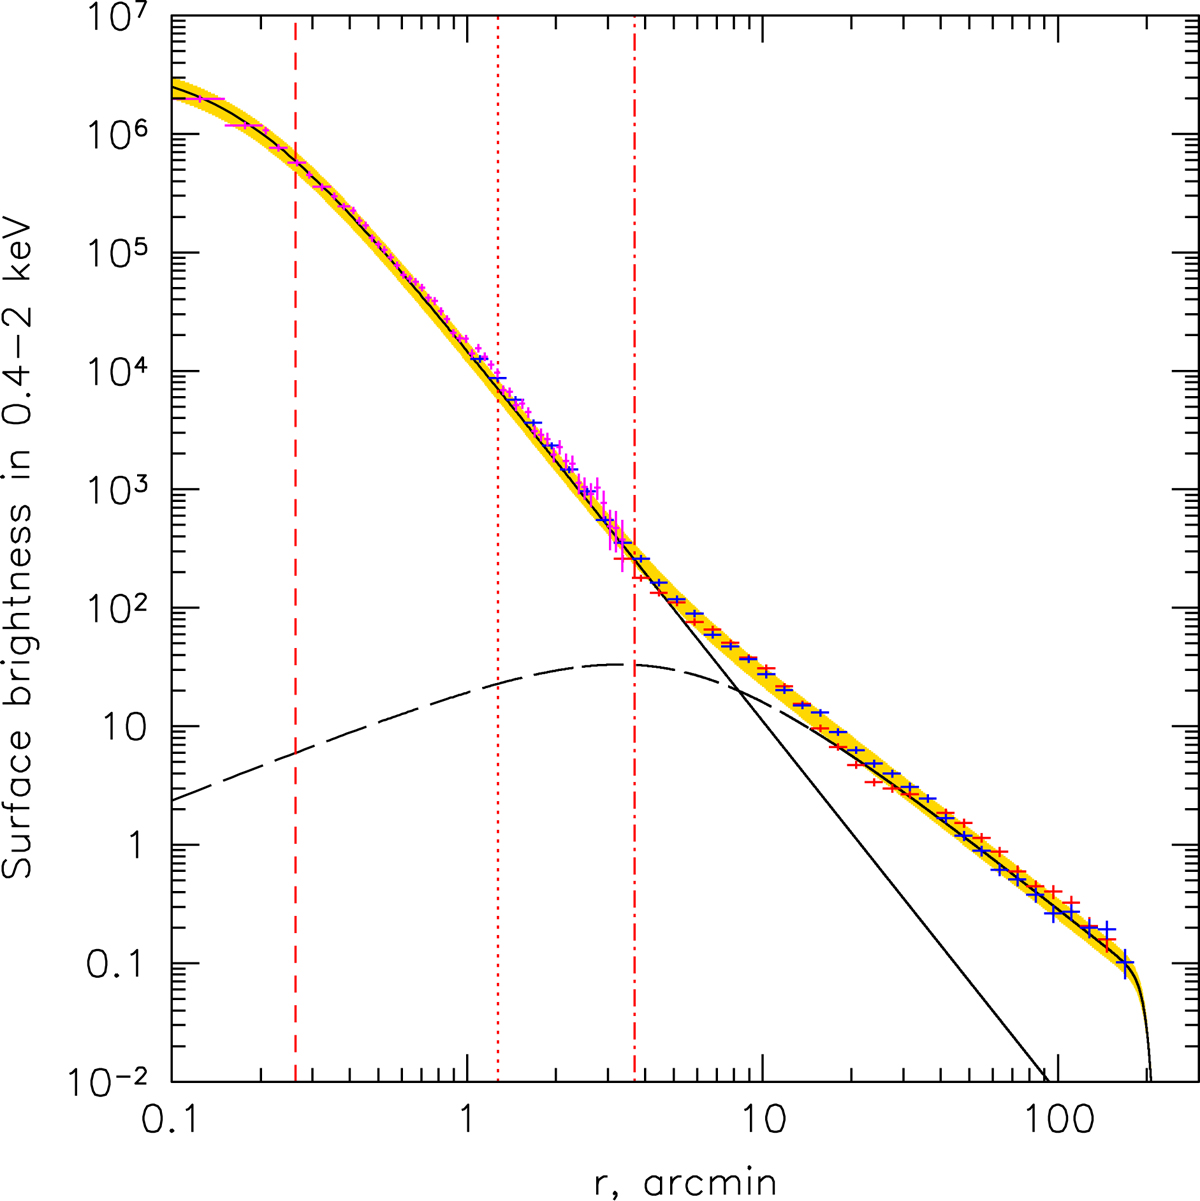
Provisional model of the radial profile of the survey PSF that includes the contribution of the stray light (the yellow thick line). Crosses correspond to samples of faint (in the core) and bright (outer regions) compact sources used to estimate the PSF at different offsets. These samples were renormalized using overlapping radial ranges. The solid and dashed black lines correspond to the “core” and “extended” (=stray light) PSF components, respectively. This separation into two components is rather arbitrary, especially at radii 5 − 20′. It was partly motivated by the desire to keep the simple functional form of the ‘core’ PSF over a broad range of radii (as in Paper I). Radii of circles encompassing 50%, 90%, and 97% of the ‘core’ PSF are marked with red lines.
Current usage metrics show cumulative count of Article Views (full-text article views including HTML views, PDF and ePub downloads, according to the available data) and Abstracts Views on Vision4Press platform.
Data correspond to usage on the plateform after 2015. The current usage metrics is available 48-96 hours after online publication and is updated daily on week days.
Initial download of the metrics may take a while.