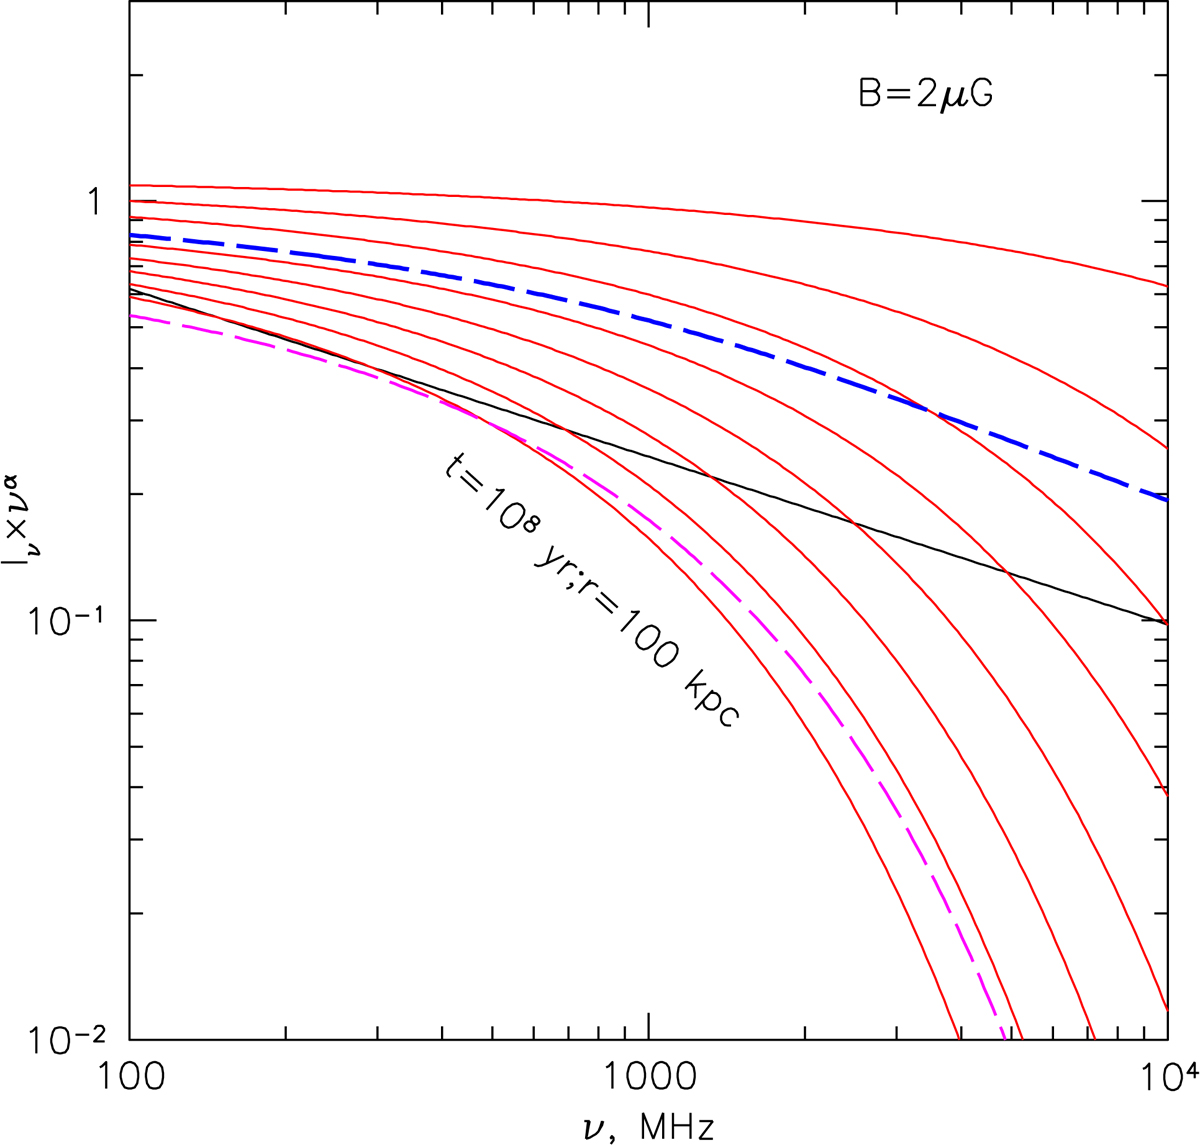
Fig. 14.
Download original image
Spectra for B = 2 μG, near the shock and at several positions downstream of the shock (up to 100 kpc), normalized by the spectrum at the shock. In terms of time, the red curves are “spaced out” by ≈13 Myr. Both the radiative losses and adiabatic expansion are taken into account. The magenta dashed line shows the spectrum at 100 kpc from the shock if changes in the particles’ Lorentz factor and magnetic fields associated with the re-expansion of the gas are ignored. The blue dashed line shows the integrated spectrum over the regions up to 100 kpc from the shock. The thin black line shows the power law with the index large by 0.4 than the initial index at the shock front (see Fig. 19 in Bonafede et al. 2022).
Current usage metrics show cumulative count of Article Views (full-text article views including HTML views, PDF and ePub downloads, according to the available data) and Abstracts Views on Vision4Press platform.
Data correspond to usage on the plateform after 2015. The current usage metrics is available 48-96 hours after online publication and is updated daily on week days.
Initial download of the metrics may take a while.