Fig. 13.
Download original image
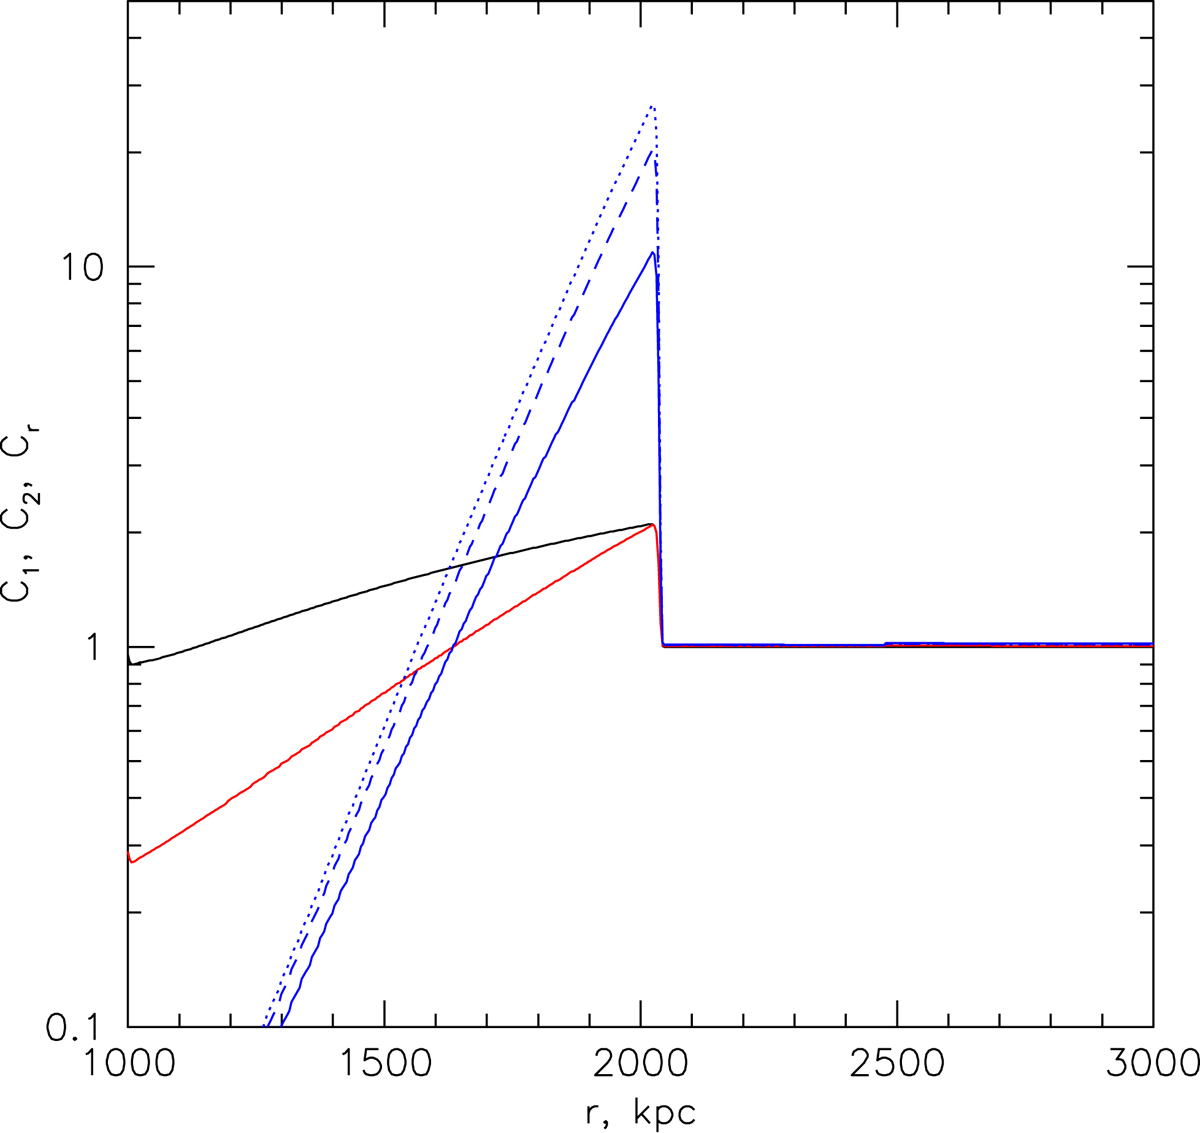
Adiabatic compression and expansion scenario (van der Laan model). Three curves show different compression factors. The black curve shows the ratio of the current density at a given radius to the initial density at this radius, i.e., ![]() . Currently, the shock is at r = 2000 kpc. The red curve shows the ratio of the current density at a given radius to the initial density of the same gas lump, i.e.,
. Currently, the shock is at r = 2000 kpc. The red curve shows the ratio of the current density at a given radius to the initial density of the same gas lump, i.e., ![]() . These two factors differ because the shock displaces the gas from its initial location. The solid blue curve shows the radio emissivity boost factor in the van der Laan model for p = 3.36. This model assumes pure adiabatic evolution of the relativistic particle spectrum in response to the compression of the gas (=C2). The blue solid line corresponds to the case when thermal and non-thermal plasmas are mixed on microscopic scales and the contribution of non-thermal particles to the total energy density is subdominant. For comparison, the dotted and dashed blue curves correspond to the adiabatic compression of a volume-filling relativistic plasma (dotted) and to the relativistic plasma confined to small bubbles and filaments (dashed). The observed width of the bright part of the radio relic is ∼3′, which is ≲100 kpc, corresponding to r ≈ 2000 − 100 ≈ 1900 kpc. The shock was passing through the gas at this location approximately 100 Myr ago. This suggests that adiabatic losses have a relatively minor impact on the radio emission on these spatial scales – unless the spectrum is very steep.
. These two factors differ because the shock displaces the gas from its initial location. The solid blue curve shows the radio emissivity boost factor in the van der Laan model for p = 3.36. This model assumes pure adiabatic evolution of the relativistic particle spectrum in response to the compression of the gas (=C2). The blue solid line corresponds to the case when thermal and non-thermal plasmas are mixed on microscopic scales and the contribution of non-thermal particles to the total energy density is subdominant. For comparison, the dotted and dashed blue curves correspond to the adiabatic compression of a volume-filling relativistic plasma (dotted) and to the relativistic plasma confined to small bubbles and filaments (dashed). The observed width of the bright part of the radio relic is ∼3′, which is ≲100 kpc, corresponding to r ≈ 2000 − 100 ≈ 1900 kpc. The shock was passing through the gas at this location approximately 100 Myr ago. This suggests that adiabatic losses have a relatively minor impact on the radio emission on these spatial scales – unless the spectrum is very steep.
Current usage metrics show cumulative count of Article Views (full-text article views including HTML views, PDF and ePub downloads, according to the available data) and Abstracts Views on Vision4Press platform.
Data correspond to usage on the plateform after 2015. The current usage metrics is available 48-96 hours after online publication and is updated daily on week days.
Initial download of the metrics may take a while.