Fig. 11.
Download original image
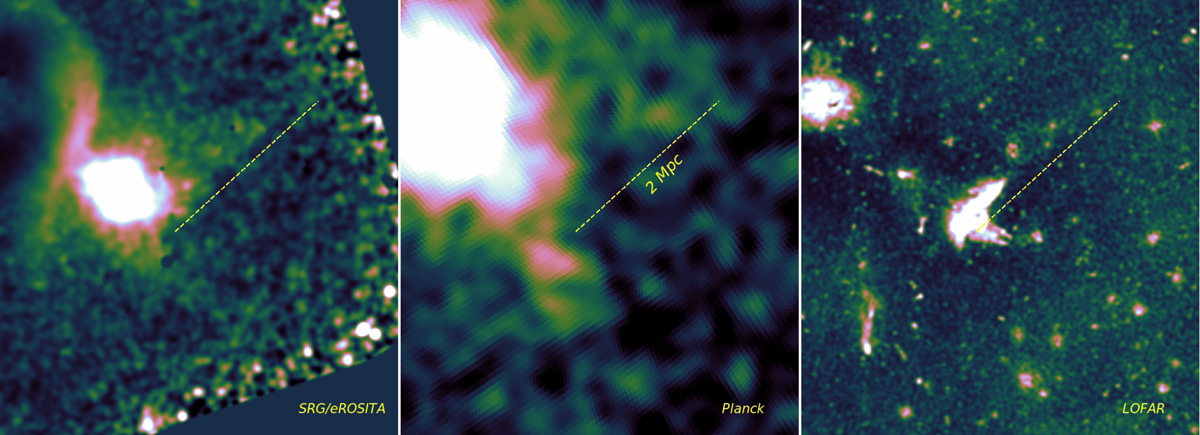
X-ray, tSZ, and radio images of the relic region. The same dashed line in all plots has a length of 2 Mpc. The line is slightly shifted from the relic outer edge and the shock front for clarity. The relic outer edge appears to be aligned with the surface brightness edges in X-rays and tSZ (although the images, unlike the radial profiles, are too noisy to draw a firm conclusion). Beyond the brightest portion of the relic, both tSZ and X-rays show a faint extended emission and edge to the NW, approximately aligned with the relic edge. If this is a continuation of the shock, then its shape is far from a spherical surface centered at Coma. For a discussion of radio emission in this region, which is affected by the bright source Coma-A/NGC 4827, we refer, for instance, to Brown & Rudnick (2011), Bonafede et al. (2022). On the SW side, an extension in the radial direction is seen in the tSZ and X-ray images, hinting at the presence of a gaseous filament along the direction towards A1367.
Current usage metrics show cumulative count of Article Views (full-text article views including HTML views, PDF and ePub downloads, according to the available data) and Abstracts Views on Vision4Press platform.
Data correspond to usage on the plateform after 2015. The current usage metrics is available 48-96 hours after online publication and is updated daily on week days.
Initial download of the metrics may take a while.