Fig. 1.
Download original image
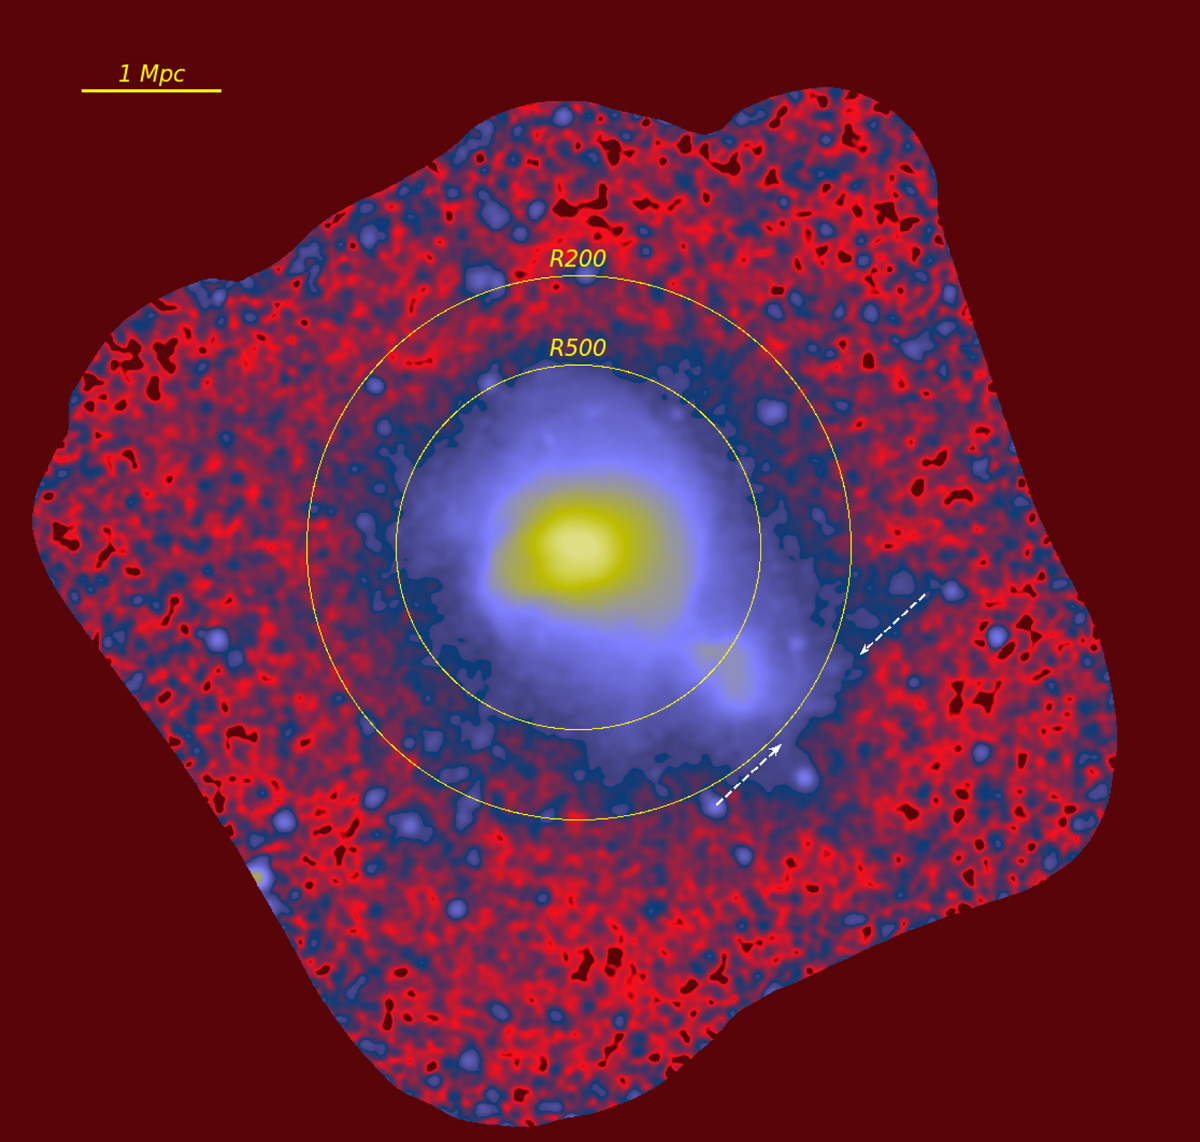
Coma cluster 5 × 5 deg image in the 0.4−2.3 keV band based on CPV data. Individual bright sources have been removed from the image. The resulting image (detector background subtracted and vignetting corrected) is smoothed with a σ = 60″ Gaussian. The two circles show the estimated positions of R500c and R200c. The excess emission at r ∼ R500c in the SW direction is very clear. Indeed, in the majority of other directions, a similar level of X-rays surface brightness is more characteristic for r ≈ R500c. Two arrows show the position of the 1253+275 radio source (its brightest part). A surface brightness edge is visible close to the position of the relic.
Current usage metrics show cumulative count of Article Views (full-text article views including HTML views, PDF and ePub downloads, according to the available data) and Abstracts Views on Vision4Press platform.
Data correspond to usage on the plateform after 2015. The current usage metrics is available 48-96 hours after online publication and is updated daily on week days.
Initial download of the metrics may take a while.