Fig. 7.

Download original image
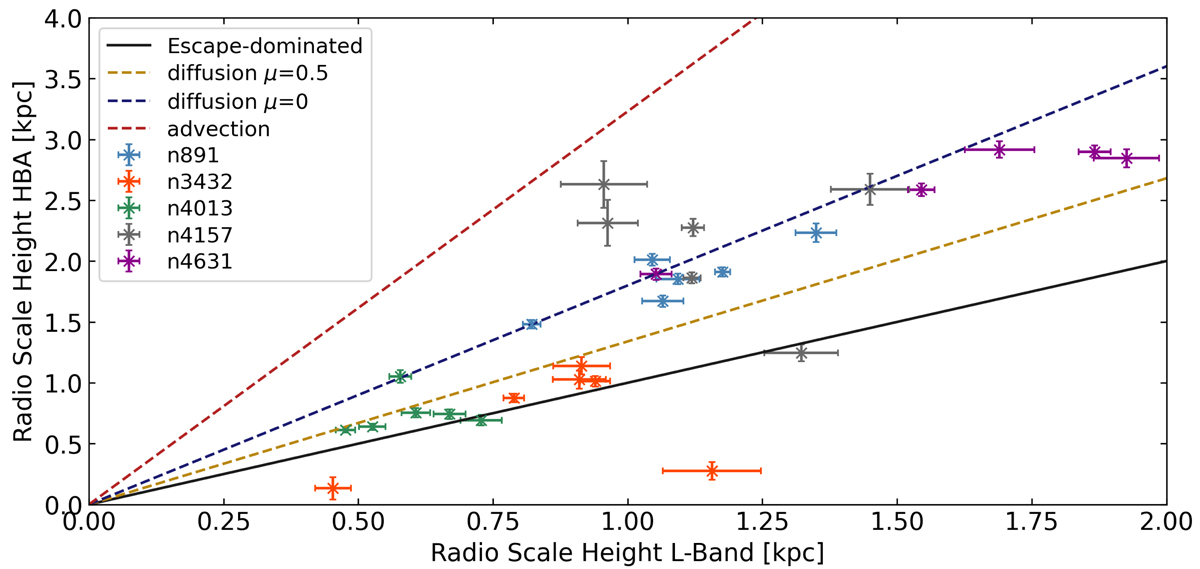
Comparison of fitted non-thermal radio scale heights in the VLA L band and LOFAR HBA. For each strip of each galaxy, the radio scale height in the HBA data is plotted against its L-band counterpart. Individual galaxies are colour coded as indicated in the legend. The solid black line represents the identity relation one would expect in escape-dominated halos. Dashed lines indicate expected scale height ratios for loss-dominated halos: dark blue represents energy-independent diffusion, gold represents energy-dependent diffusion, and red represents advection.
Current usage metrics show cumulative count of Article Views (full-text article views including HTML views, PDF and ePub downloads, according to the available data) and Abstracts Views on Vision4Press platform.
Data correspond to usage on the plateform after 2015. The current usage metrics is available 48-96 hours after online publication and is updated daily on week days.
Initial download of the metrics may take a while.


