Open Access
Fig. 17
Download original image
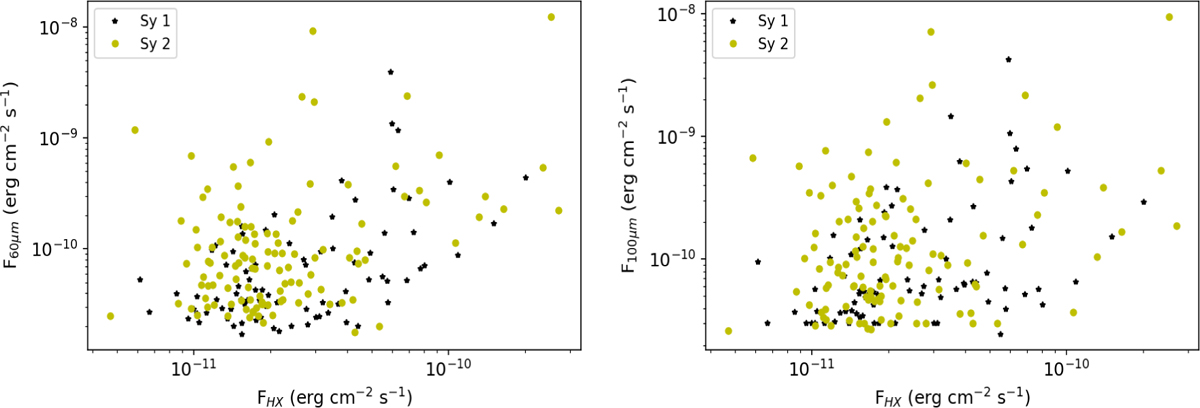
Fluxes at 60 μm (left panel) and 100 μm (right panel) as a function of hard X-ray flux. Seyfert 1 and 2 galaxies are marked in black and yellow, respectively. No neat trend is evident between the two emissions.
Current usage metrics show cumulative count of Article Views (full-text article views including HTML views, PDF and ePub downloads, according to the available data) and Abstracts Views on Vision4Press platform.
Data correspond to usage on the plateform after 2015. The current usage metrics is available 48-96 hours after online publication and is updated daily on week days.
Initial download of the metrics may take a while.