Fig. 16
Download original image
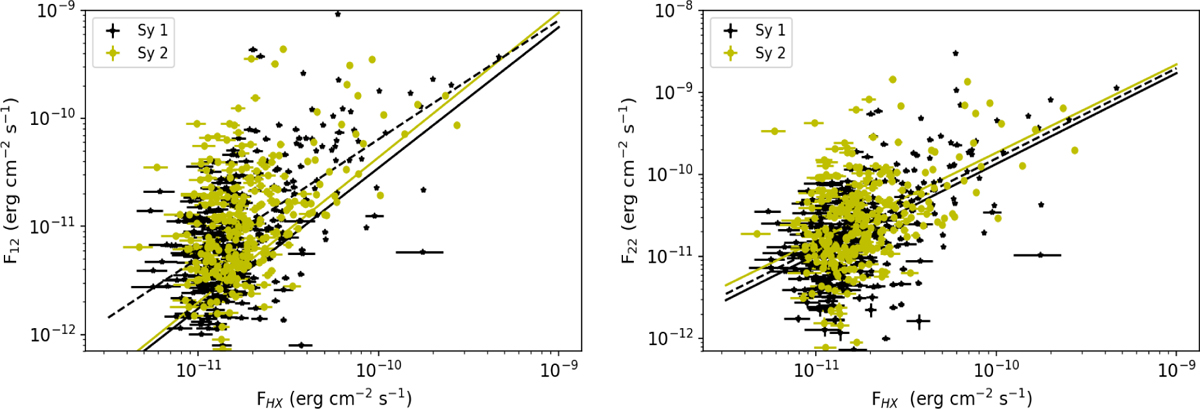
Mid-IR fluxes at 12 μm (left panel) and 22 μm (right panel) as a function of hard X-ray flux. Regression lines were computed for the correlations between the W3 integrated flux and that in the hard X-ray band from the 3PBC, for both Seyfert 1 and 2 galaxies, marked in black and yellow, respectively. The dashed black line corresponds to the regression line computed for the whole sample, while the straight black and yellow lines mark that for type 1 and type 2 Seyfert galaxies, respectively. The correlation coefficients are reported in Sect. 5.
Current usage metrics show cumulative count of Article Views (full-text article views including HTML views, PDF and ePub downloads, according to the available data) and Abstracts Views on Vision4Press platform.
Data correspond to usage on the plateform after 2015. The current usage metrics is available 48-96 hours after online publication and is updated daily on week days.
Initial download of the metrics may take a while.