Open Access
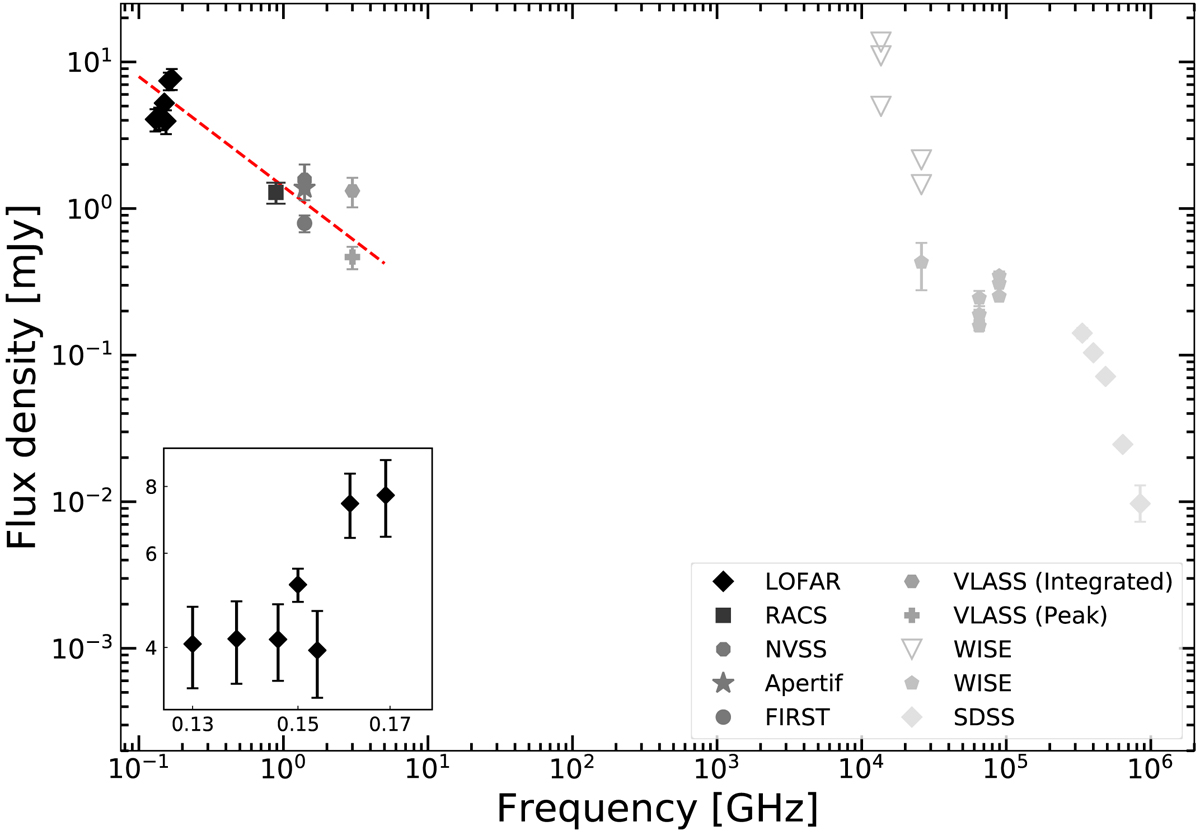
Fig. A.1.
Download original image
Flux-density measurements (mJy) as a function of frequency (GHz) for J1304+2938 from 0.1 to 106 GHz. The inset shows the LOFAR data, while the arrows indicate the 3σ upper limits. Data are taken at different epochs (see Table A.1). The dashed red line corresponds to a power law F ∝ να with spectral index α = −0.75.
Current usage metrics show cumulative count of Article Views (full-text article views including HTML views, PDF and ePub downloads, according to the available data) and Abstracts Views on Vision4Press platform.
Data correspond to usage on the plateform after 2015. The current usage metrics is available 48-96 hours after online publication and is updated daily on week days.
Initial download of the metrics may take a while.