Fig. E.2
Download original image
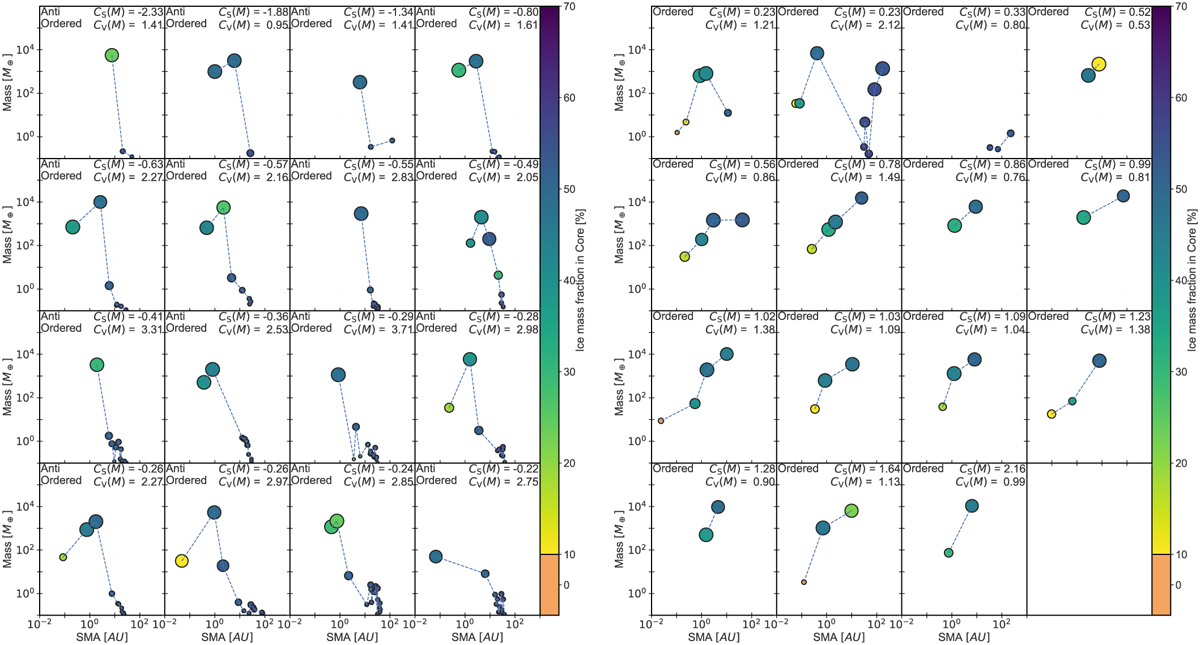
A gallery of planetary system architectures. These plots show the mass-distance diagram for anti-ordered (left) and ordered (right) planetary systems from the Bern Model. Each circle represents a planet, its size corresponds to the planetary radius, and its colour represents the fraction of ice in the planetary core. Each panel shows the CS (M) as well as the CV(M) of the system.
Current usage metrics show cumulative count of Article Views (full-text article views including HTML views, PDF and ePub downloads, according to the available data) and Abstracts Views on Vision4Press platform.
Data correspond to usage on the plateform after 2015. The current usage metrics is available 48-96 hours after online publication and is updated daily on week days.
Initial download of the metrics may take a while.