Fig. D.2
Download original image
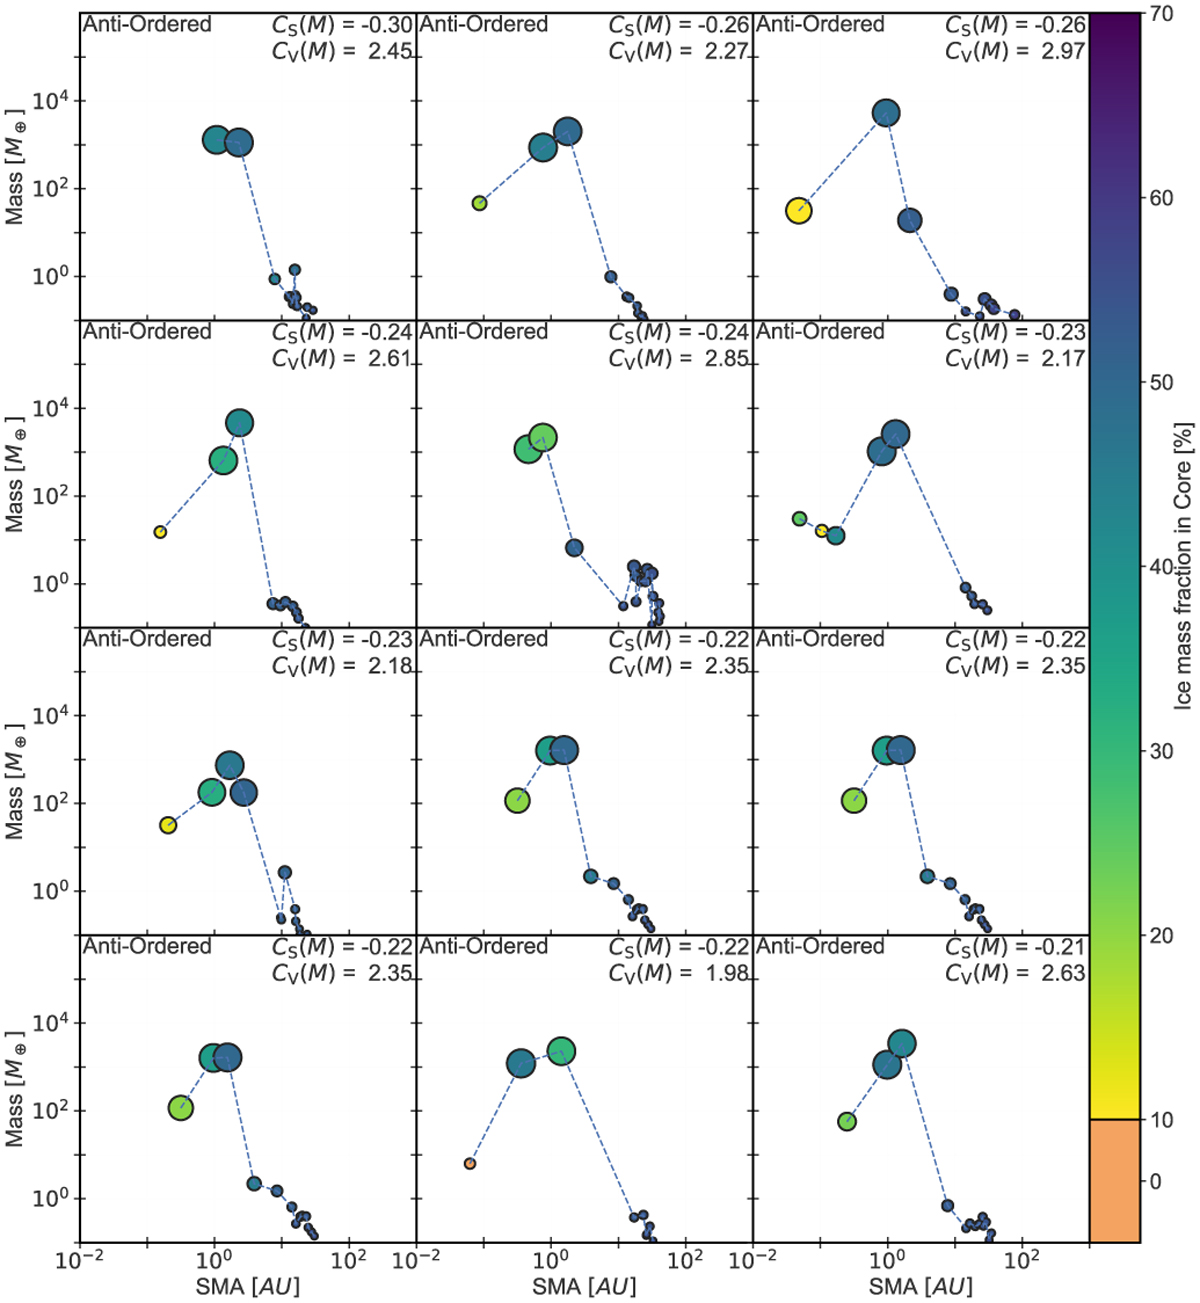
Mass-distance diagram. This plot shows the planetary masses as a function of distance for some planetary systems with −0.3 < CS (M) < −0.2. The dashed line connects that planets in the system and serves to highlight the arrangement and distribution of masses. The size of each circle corresponds to the planet's radius and the colour of each planet also shows its core water mass fraction.
Current usage metrics show cumulative count of Article Views (full-text article views including HTML views, PDF and ePub downloads, according to the available data) and Abstracts Views on Vision4Press platform.
Data correspond to usage on the plateform after 2015. The current usage metrics is available 48-96 hours after online publication and is updated daily on week days.
Initial download of the metrics may take a while.