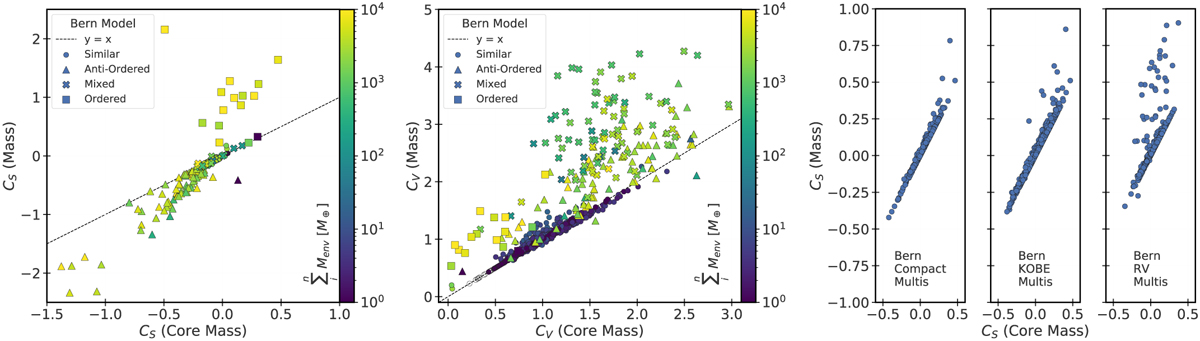
Fig. 10
Download original image
Mass architecture as a function of core-mass architecture. Panels compare the mass architecture with the core-mass architecture via the coefficient of similarity (left) and coefficient of variation (middle). In the left panel, the points corresponding to similar systems are very tightly clustered on the y = x line and are not visible due to over-plotting of points from other architectures. This signifies the core-mass architecture is very strongly correlated with the mass architecture for similar systems. The sum of mass in the envelope of each planet in a system is indicated in colour. The right panel plots the coefficient of similarity for masses and core masses for systems in the synthetically observed catalogues.
Current usage metrics show cumulative count of Article Views (full-text article views including HTML views, PDF and ePub downloads, according to the available data) and Abstracts Views on Vision4Press platform.
Data correspond to usage on the plateform after 2015. The current usage metrics is available 48-96 hours after online publication and is updated daily on week days.
Initial download of the metrics may take a while.