Open Access
Fig. 5.
Download original image
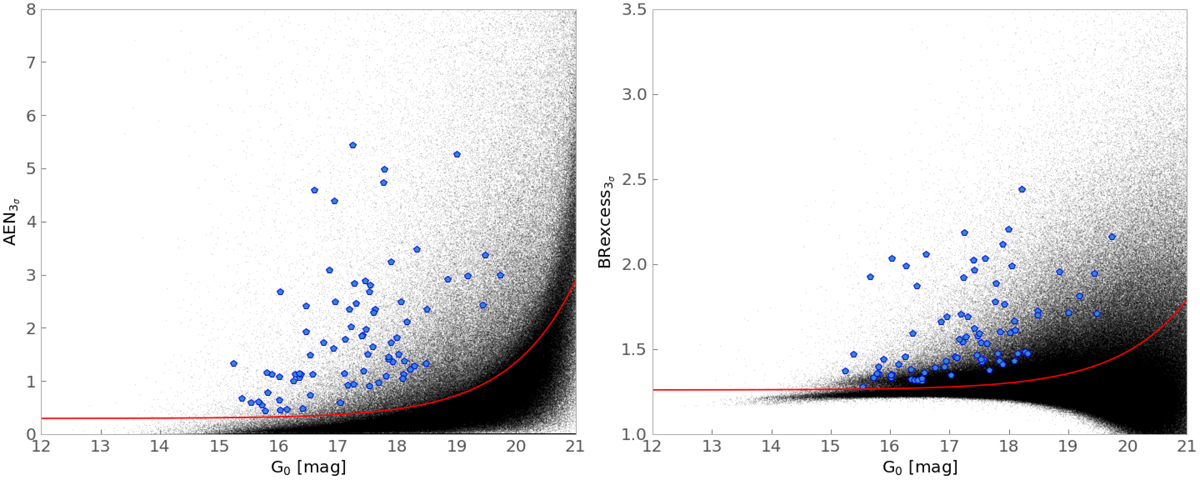
AENs and BRexcess as a function of the G magnitudes (left and right panels, respectively). The point sources are over-plotted with our final sample in blue. The red curves show the 3σ criteria derived by Hughes et al. (2021) to select GCs in NGC 5128.
Current usage metrics show cumulative count of Article Views (full-text article views including HTML views, PDF and ePub downloads, according to the available data) and Abstracts Views on Vision4Press platform.
Data correspond to usage on the plateform after 2015. The current usage metrics is available 48-96 hours after online publication and is updated daily on week days.
Initial download of the metrics may take a while.