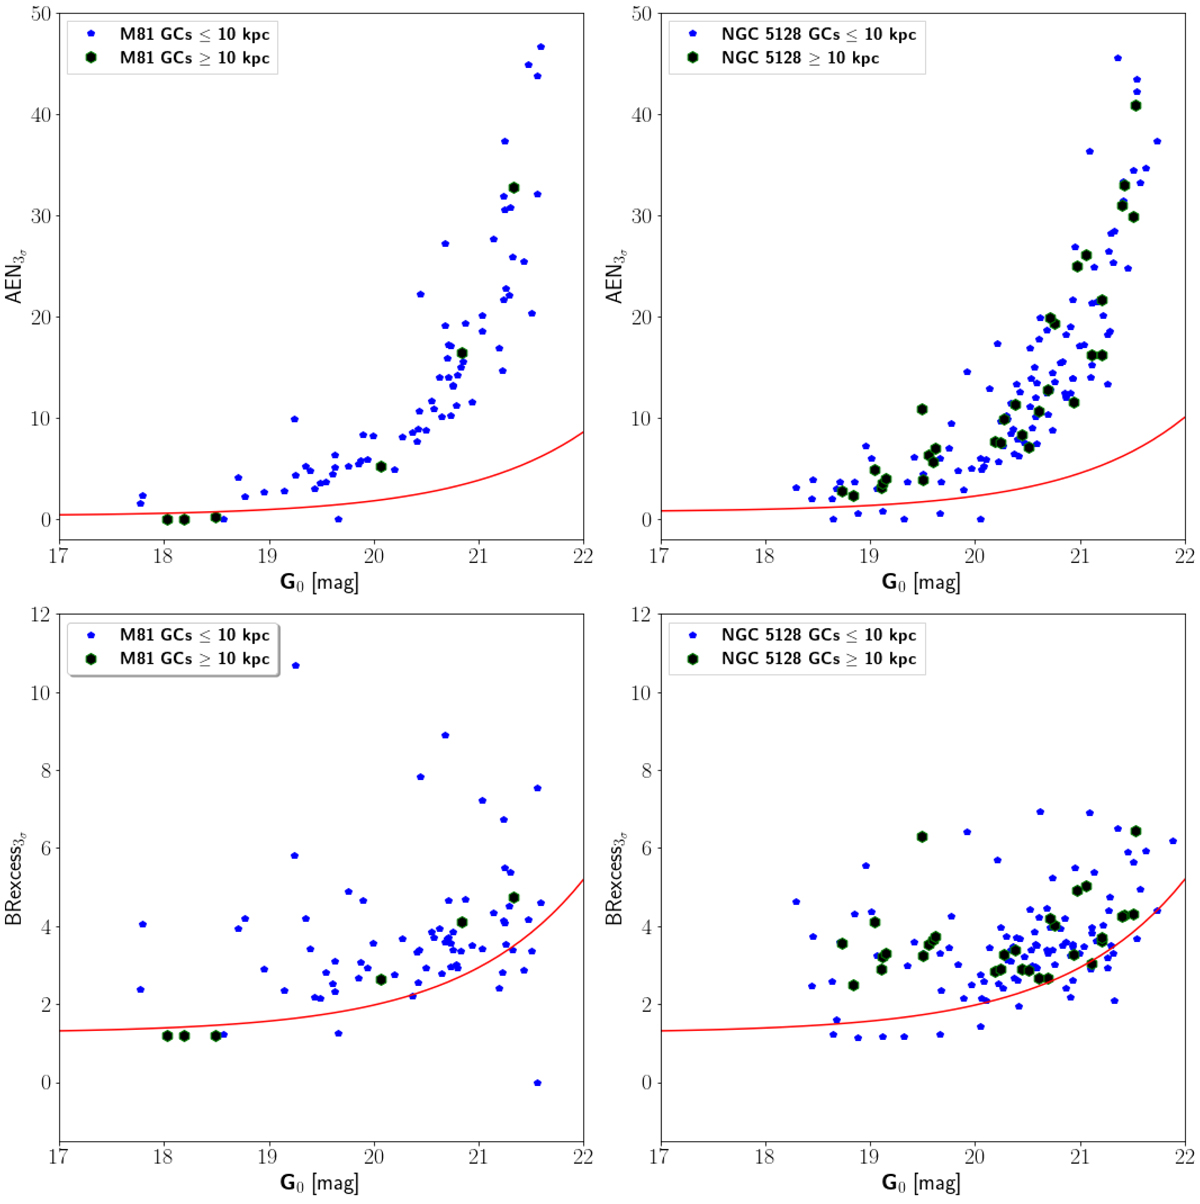
Fig. 4.
Download original image
Spectroscopically confirmed GCs in M 81 (Nantais & Huchra 2010) and NGC 5128 (Woodley et al. 2009) combined with Taylor et al. (2015) and Gaia catalogues. The AENs and BRexcess as a function of the G magnitudes are shown in the upper and bottom panels, respectively. Blue points represent GCs at ≤10 kpc from the galaxy centre while black points, those GCs at ≥10 kpc. The red curve defines 3σ above the mean foreground stars.
Current usage metrics show cumulative count of Article Views (full-text article views including HTML views, PDF and ePub downloads, according to the available data) and Abstracts Views on Vision4Press platform.
Data correspond to usage on the plateform after 2015. The current usage metrics is available 48-96 hours after online publication and is updated daily on week days.
Initial download of the metrics may take a while.