Open Access
Fig. 3.
Download original image
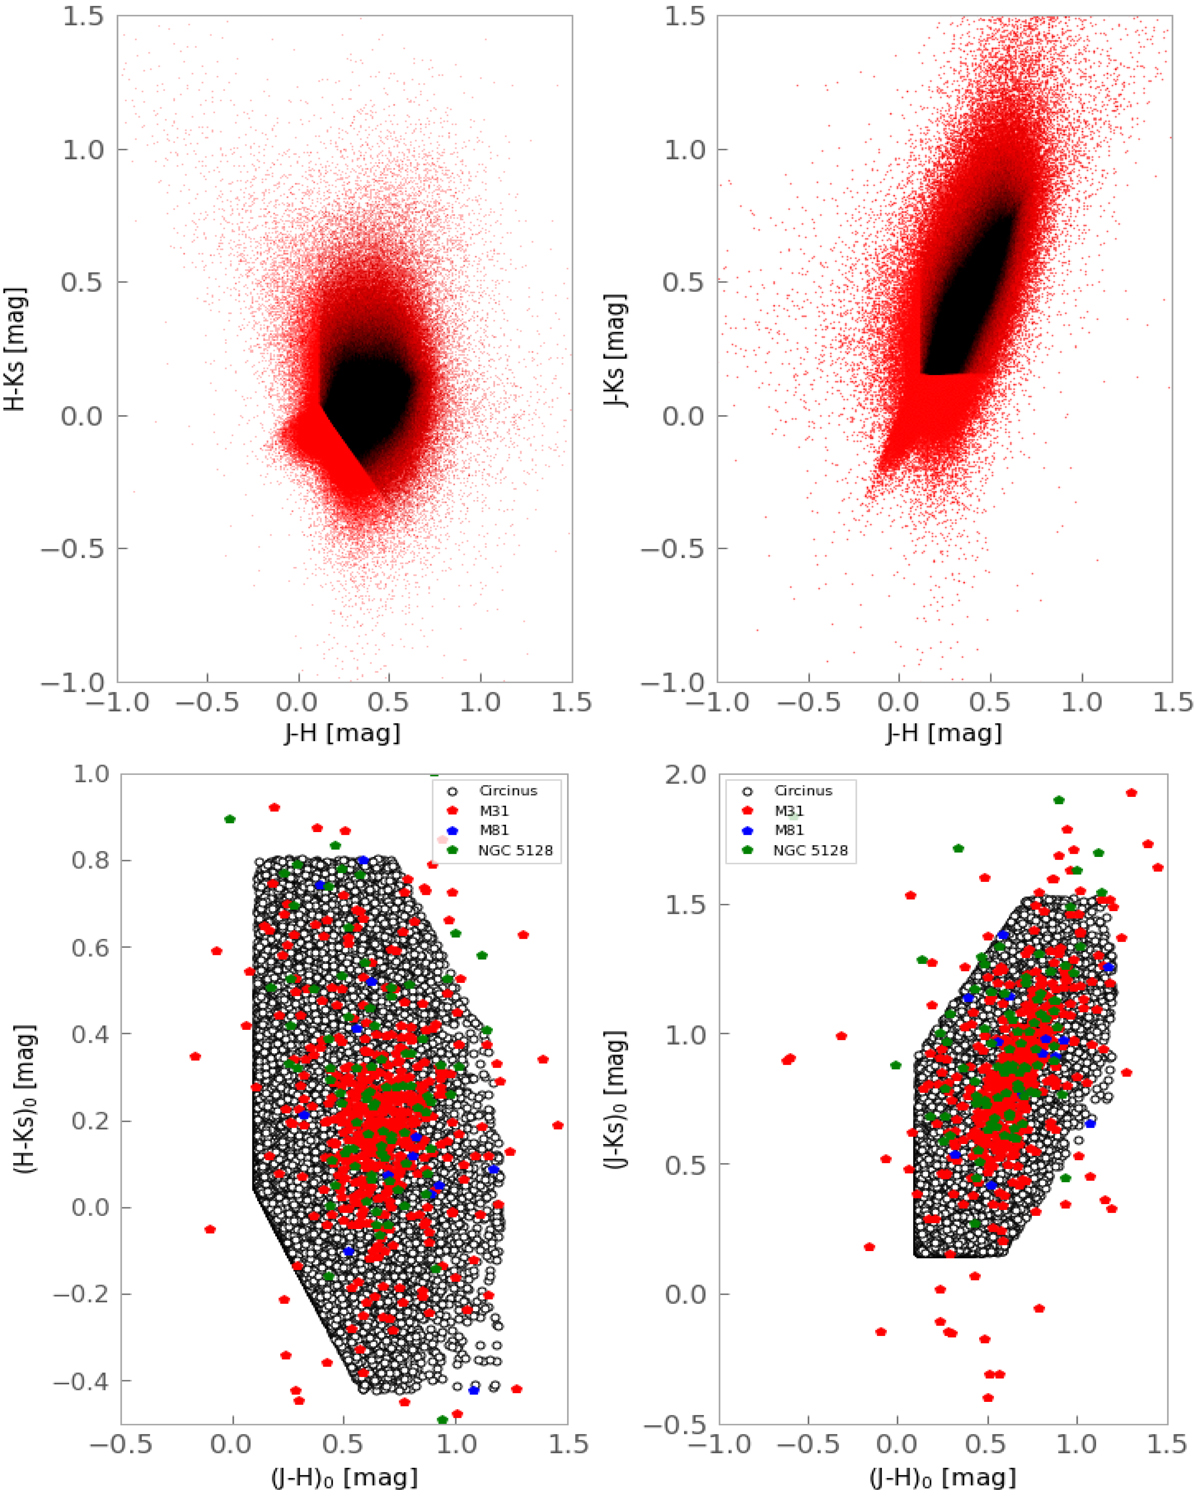
Colour–colour diagrams H − Ks vs J − H and J − Ks vs J − H (upper panels) showing the colour cuts used for the analysis (in black). The lower panels reproduce the same region, but overplotted with GCs from M 31 (Wang et al. 2014), M 81 (Nantais & Huchra 2010), and NGC 5128 (Woodley et al. 2009; Taylor et al. 2015).
Current usage metrics show cumulative count of Article Views (full-text article views including HTML views, PDF and ePub downloads, according to the available data) and Abstracts Views on Vision4Press platform.
Data correspond to usage on the plateform after 2015. The current usage metrics is available 48-96 hours after online publication and is updated daily on week days.
Initial download of the metrics may take a while.