Open Access
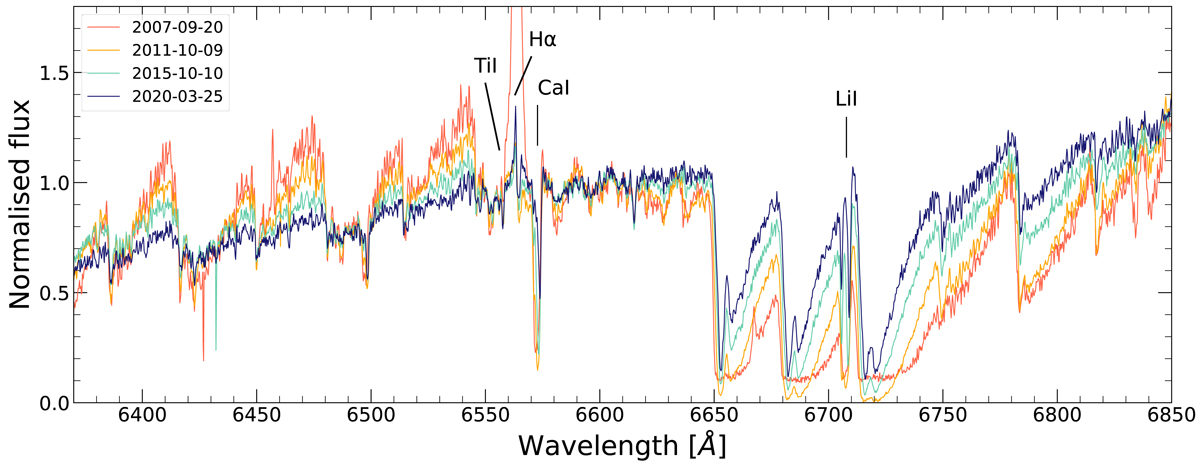
Fig. 9.
Download original image
Example medium-resolution spectra for three selected dates with the most prominent atomic features identified. As a comparison, a spectrum from before the deep minimum (2007) is plotted in red. Normalisation of the calibrated spectra is performed at λ = 6577 Å.
Current usage metrics show cumulative count of Article Views (full-text article views including HTML views, PDF and ePub downloads, according to the available data) and Abstracts Views on Vision4Press platform.
Data correspond to usage on the plateform after 2015. The current usage metrics is available 48-96 hours after online publication and is updated daily on week days.
Initial download of the metrics may take a while.