Fig. 6.
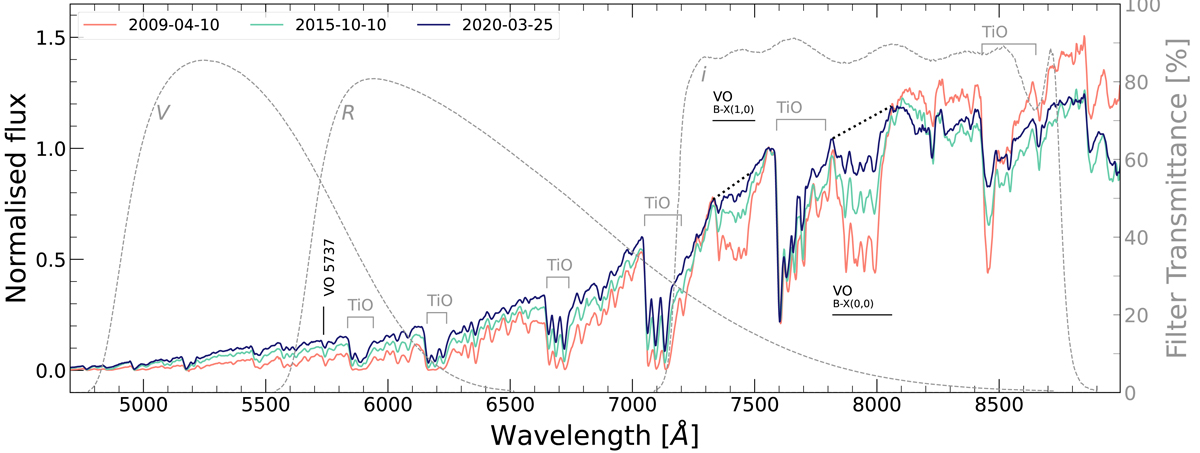
Download original image
Example low-resolution spectra for three selected epochs with the most prominent molecular band features identified. Normalisation of the calibrated spectra is performed at λ = 7560 Å. Black dotted lines exemplary mark the pseudo-continuum for measuring the (pseudo-)equivalent widths of the VO band structures B-X(1,0) and B-X(0,0) in the 2020 spectrum. The NOT transmission curves of the ALFOSC V, R, and i filters are shown with grey dashed lines.
Current usage metrics show cumulative count of Article Views (full-text article views including HTML views, PDF and ePub downloads, according to the available data) and Abstracts Views on Vision4Press platform.
Data correspond to usage on the plateform after 2015. The current usage metrics is available 48-96 hours after online publication and is updated daily on week days.
Initial download of the metrics may take a while.