Open Access
Fig. B.1.
Download original image
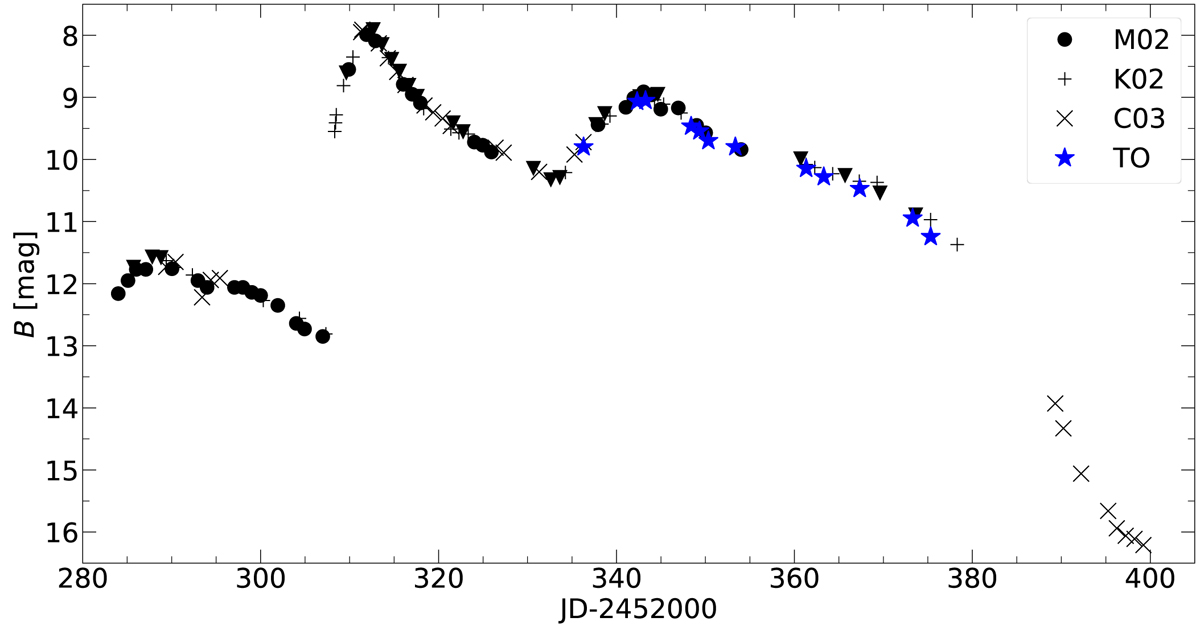
V838 Mon outburst between January and May 2002 in the B band, as reported by various authors. A good match between the literature (black) and our (blue) values is visible. M02 refers to data from Munari et al. (2002), K02 to Kimeswenger et al. (2002), C03 data to Crause et al. (2003), and TO to data from this work.
Current usage metrics show cumulative count of Article Views (full-text article views including HTML views, PDF and ePub downloads, according to the available data) and Abstracts Views on Vision4Press platform.
Data correspond to usage on the plateform after 2015. The current usage metrics is available 48-96 hours after online publication and is updated daily on week days.
Initial download of the metrics may take a while.