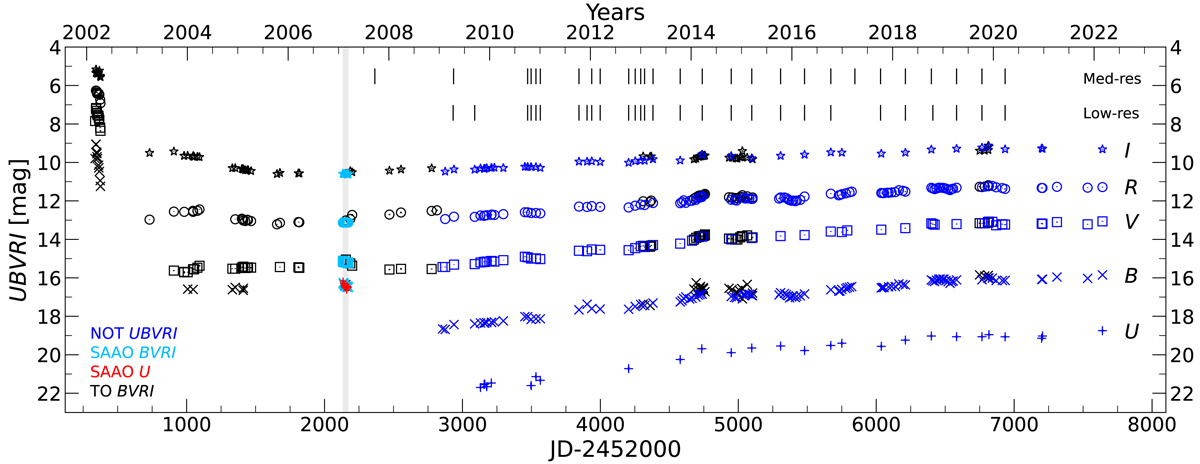
Fig. 1.
Download original image
Photometric data of V838 Mon. Colour-coding refers to the data from the various observatories, and different symbols indicate the various photometric bands. The grey area shows the period of the SAAO observations in the beginning of 2007. The U-band measurements from SAAO are marked in red, to distinguish them from the B-band values of similar magnitude. The vertical lines mark the dates with our low- and medium-resolution spectra.
Current usage metrics show cumulative count of Article Views (full-text article views including HTML views, PDF and ePub downloads, according to the available data) and Abstracts Views on Vision4Press platform.
Data correspond to usage on the plateform after 2015. The current usage metrics is available 48-96 hours after online publication and is updated daily on week days.
Initial download of the metrics may take a while.