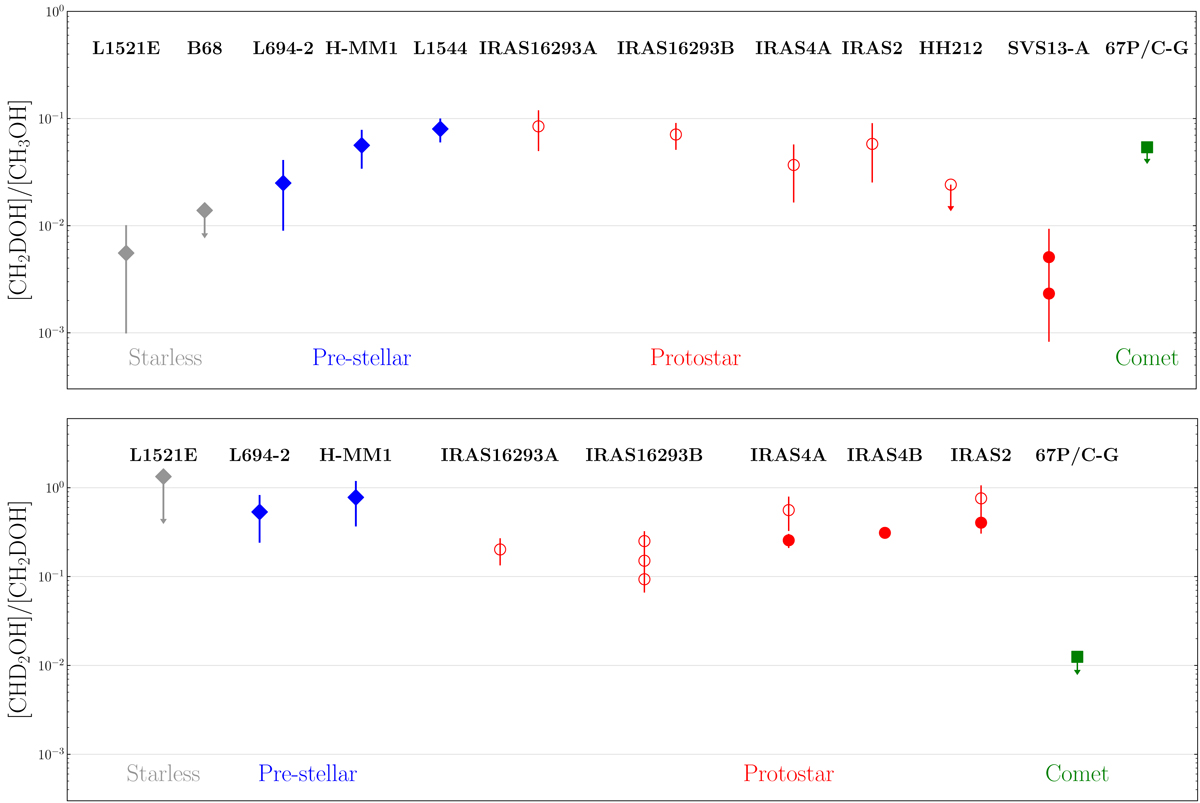
Fig. 2.
Download original image
Column density ratios of [CH2DOH]/[CH3OH] (upper panel) and [CHD2OH]/[CH2DOH] (lower panel) as a function of source types. Filled symbols indicate single-dish observations and open symbols indicate interferometric observations. Symbols with downward arrows show the derived upper limits. References: Bianchi et al. (2017a) for SVS13-A; Taquet et al. (2019) and Parise et al. (2006) for IRAS4A and IRAS2 (also IRAS4B, all located in NGC 1333); Bianchi et al. (2017b) for HH212; Manigand et al. (2019), Jørgensen et al. (2016), Drozdovskaya et al. (2022) for IRAS 16293A and IRAS 16293B; Drozdovskaya & Schroeder (2021) for comet 67P/C-G. For an exhaustive plot of [CH2DOH]/[CH3OH] for all available measurements we refer to Drozdovskaya & Schroeder (2021) and their supplementary data.
Current usage metrics show cumulative count of Article Views (full-text article views including HTML views, PDF and ePub downloads, according to the available data) and Abstracts Views on Vision4Press platform.
Data correspond to usage on the plateform after 2015. The current usage metrics is available 48-96 hours after online publication and is updated daily on week days.
Initial download of the metrics may take a while.