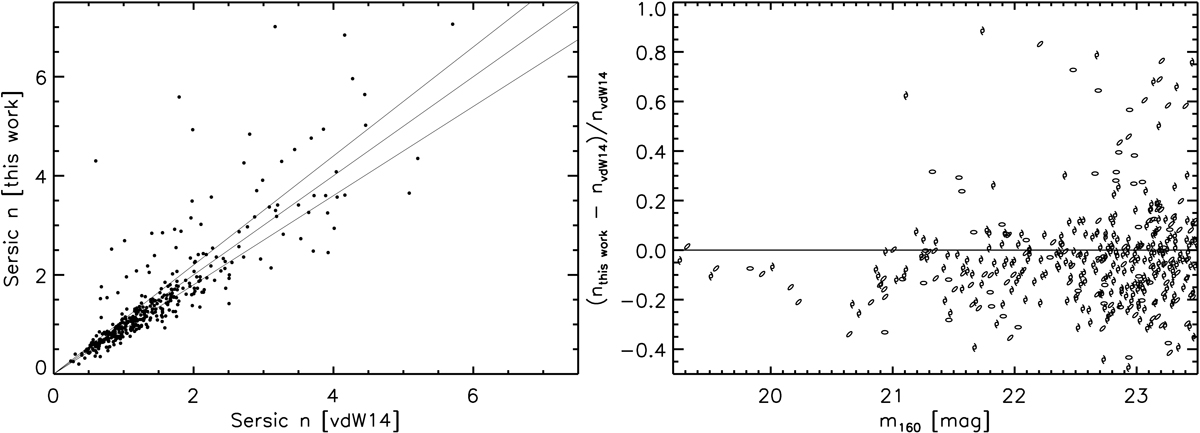
Fig. A.3.
Download original image
Comparison of Sersic indices as measured with this work procedures vs. van der Wel et al. (2014) estimates adopted for the field sample, for the same sources as in Fig. A.1 (see text). Left: The direct comparison of the two measurements. The solid lines show the bisector (middle), and the expected average uncertainty (1σ) on Sersic indices from this work, as estimated with simulations (see Sect. 2.4) for sources at the faint end of the probed magnitude range. Right: The fractional difference between the two measurements as a function of m160 magnitude (3% of the sources out of the plotted range are not shown). Symbols are coded by Sersic index, as in Fig. A.1.
Current usage metrics show cumulative count of Article Views (full-text article views including HTML views, PDF and ePub downloads, according to the available data) and Abstracts Views on Vision4Press platform.
Data correspond to usage on the plateform after 2015. The current usage metrics is available 48-96 hours after online publication and is updated daily on week days.
Initial download of the metrics may take a while.