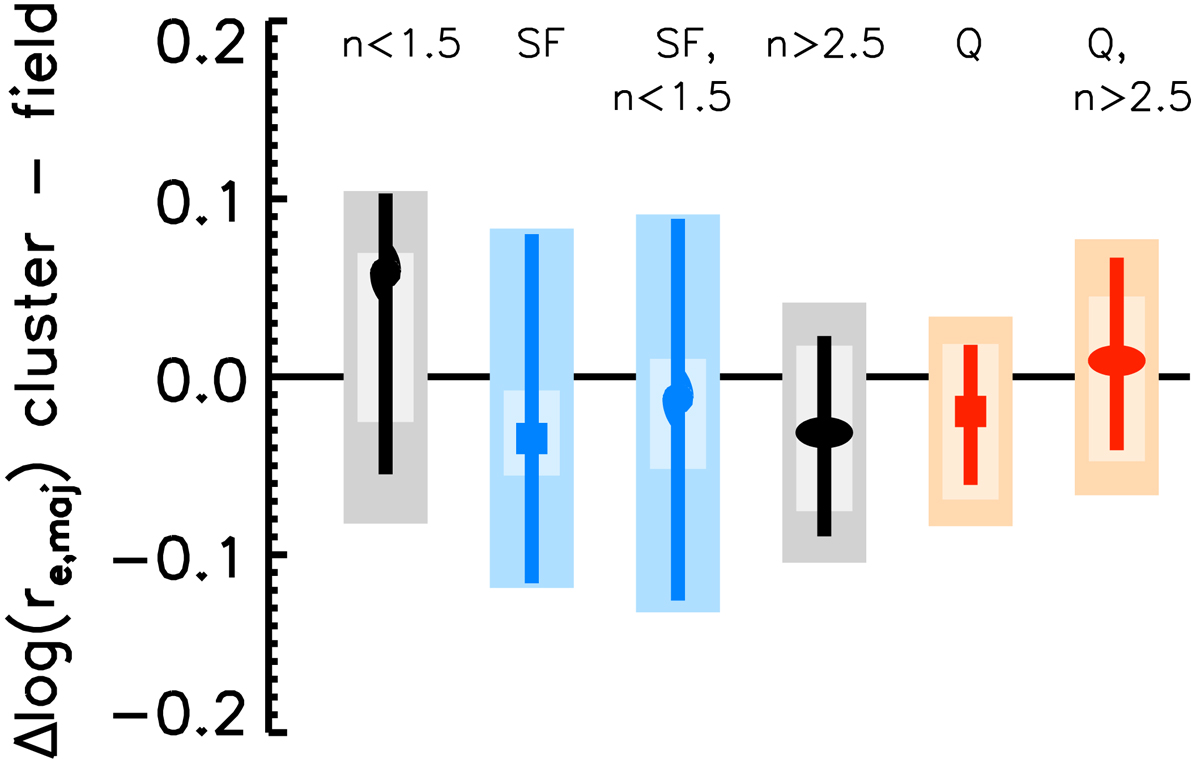
Fig. 6.
Download original image
Median log size difference between cluster and field galaxies as derived from Fig. 5, for different population sub-samples (see text). Symbols and colour coding follow Fig. 5. Error bars show statistical uncertainties (including statistical background subtraction). Light shaded rectangles show the maximum impact on the median difference from potential residual uncorrected systematics. Dark shaded rectangles show the combined error including both statistical and systematic uncertainties (see text).
Current usage metrics show cumulative count of Article Views (full-text article views including HTML views, PDF and ePub downloads, according to the available data) and Abstracts Views on Vision4Press platform.
Data correspond to usage on the plateform after 2015. The current usage metrics is available 48-96 hours after online publication and is updated daily on week days.
Initial download of the metrics may take a while.