Fig. 4.
Download original image
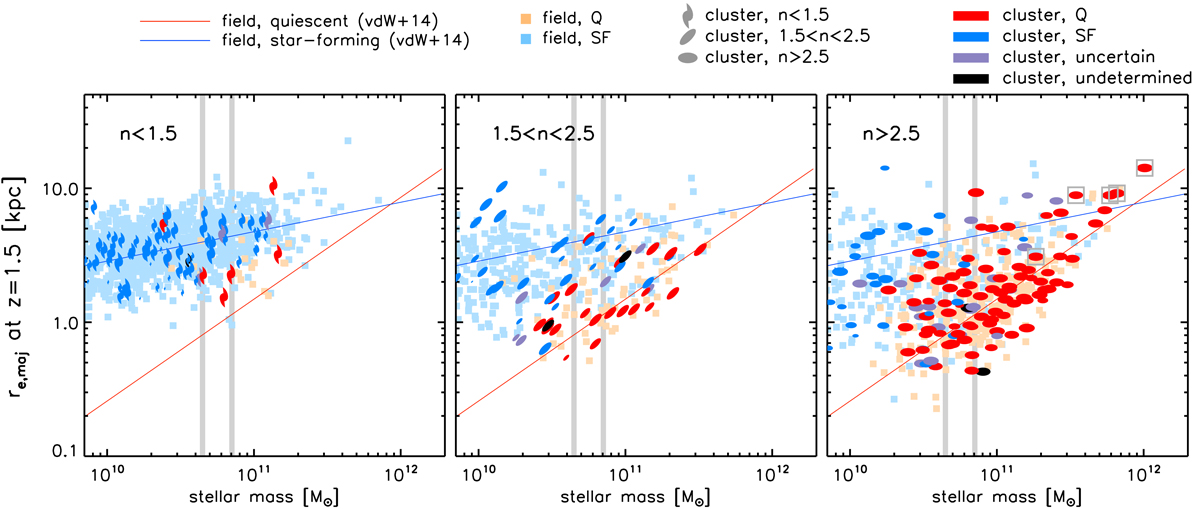
Stellar mass – size relation of candidate cluster members and field counterparts, split by Sersic index as indicated. All candidate members in the m140-limited samples across the five clusters are shown, with symbol size scaling with residual statistical background subtraction weights (Sect. 2.2.1). All sizes for both candidate members and field counterparts are scaled to a common redshift z = 1.5 for the purpose of this figure (see text). Candidate cluster members are shown with darker symbols, colour-coded by quiescent (red) vs. star-forming (blue) classification (purple and black symbols show, respectively, galaxies within ±0.1 mag from the classification border, and with no reliable classification). Large grey open squares indicate cluster BCGs (right hand panel). Light blue and light red squares in the background show counterparts from the control field sample at 1.35 < z < 1.75. The red and blue lines show the best-fit mass-size relations for quiescent and star-forming galaxies from van der Wel et al. (2014, also scaled to z = 1.5). Vertical grey lines mark the minimum and maximum stellar mass completeness limits across the five clusters.
Current usage metrics show cumulative count of Article Views (full-text article views including HTML views, PDF and ePub downloads, according to the available data) and Abstracts Views on Vision4Press platform.
Data correspond to usage on the plateform after 2015. The current usage metrics is available 48-96 hours after online publication and is updated daily on week days.
Initial download of the metrics may take a while.