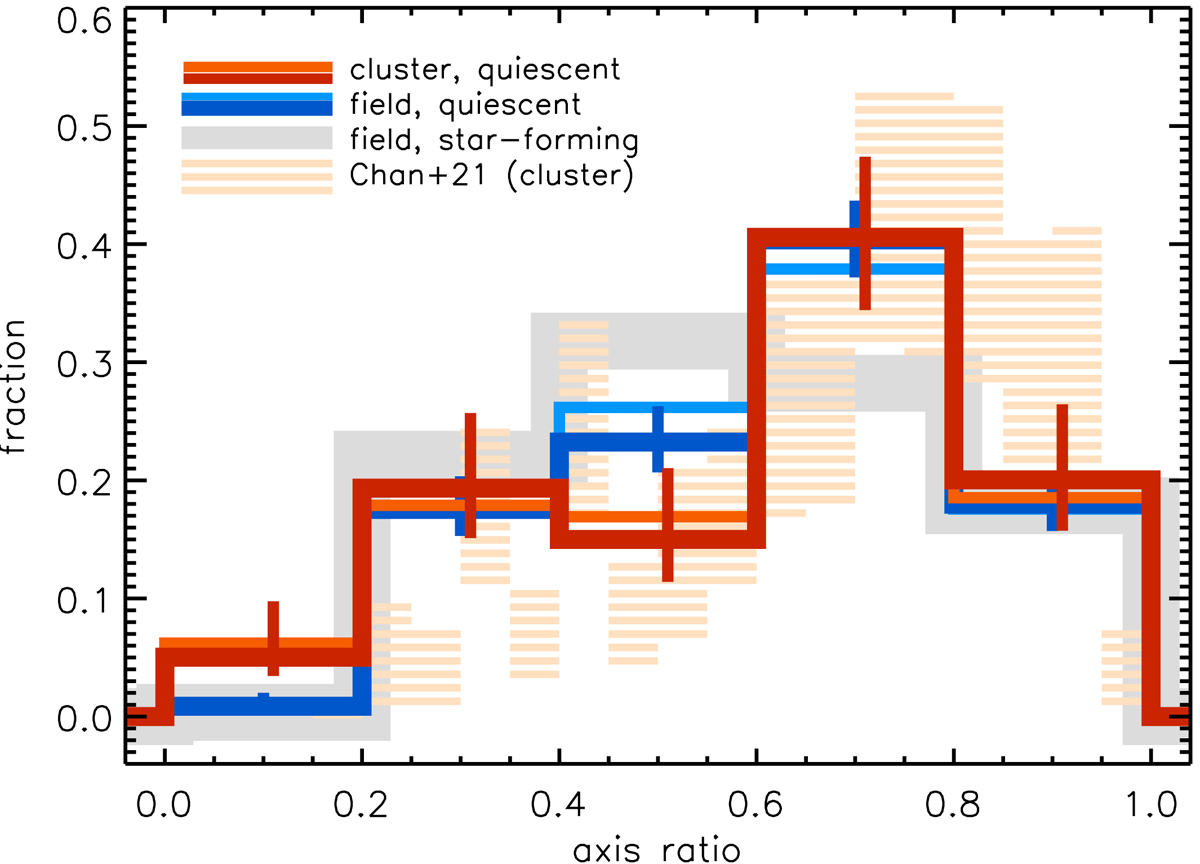
Fig. 3.
Download original image
Distribution of axis ratios of log(M/M⊙) > 10.85 quiescent cluster galaxies in the probed cluster regions across the whole cluster sample (red shades) and in the reference field at 1.3 < z < 1.8 (blue shades, as indicated). For both cluster and field samples, darker (lighter) lines correspond to excluding (including) sources within ±0.1 mag around the quiescent vs. star-forming classification border. Error bars on the fractions over the whole population (binomial, Cameron 2011) are slightly offset for clarity. For comparison, the axis ratio distribution of star-forming field galaxies in the same mass and redshift range (grey line, errors within line width), and for 1 < z < 1.4 cluster galaxies in the same stellar mass range from Chan et al. (2021, hatched region, see text for details) are also shown.
Current usage metrics show cumulative count of Article Views (full-text article views including HTML views, PDF and ePub downloads, according to the available data) and Abstracts Views on Vision4Press platform.
Data correspond to usage on the plateform after 2015. The current usage metrics is available 48-96 hours after online publication and is updated daily on week days.
Initial download of the metrics may take a while.