Fig. A.4.
Download original image
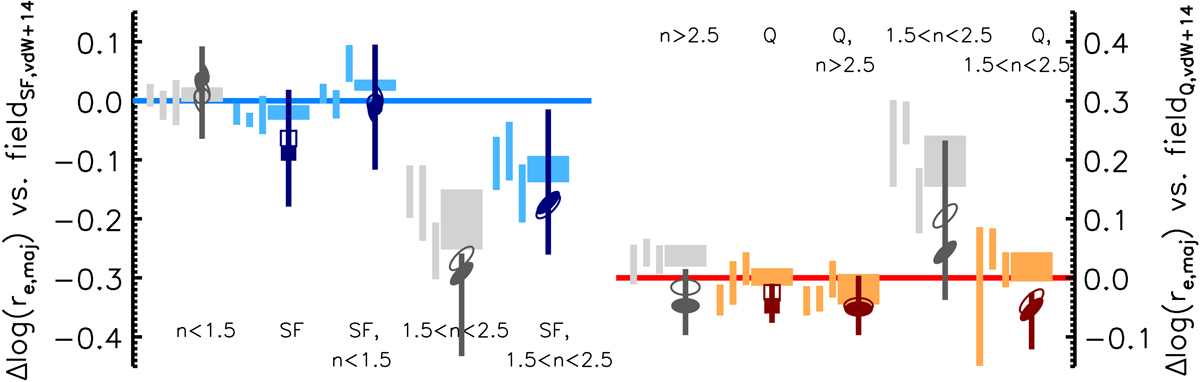
As Fig. 5, but showing sizes for cluster galaxies as measured (not corrected for estimated size bias with respect to control field sample, see text for details). Empty symbols also show the measurement for the full relevant candidate cluster member samples, not accounting for residual background contamination (solid symbols account instead for residual background contamination as in Fig. 5). The three vertical lines on the left of the control field measurements show the field sample split by redshift (1.3 < z < 1.5, 1.4 < z < 1.6, 1.6 < z < 1.8), showing no redshift dependence in the field measurements across the redshift range of interest.
Current usage metrics show cumulative count of Article Views (full-text article views including HTML views, PDF and ePub downloads, according to the available data) and Abstracts Views on Vision4Press platform.
Data correspond to usage on the plateform after 2015. The current usage metrics is available 48-96 hours after online publication and is updated daily on week days.
Initial download of the metrics may take a while.