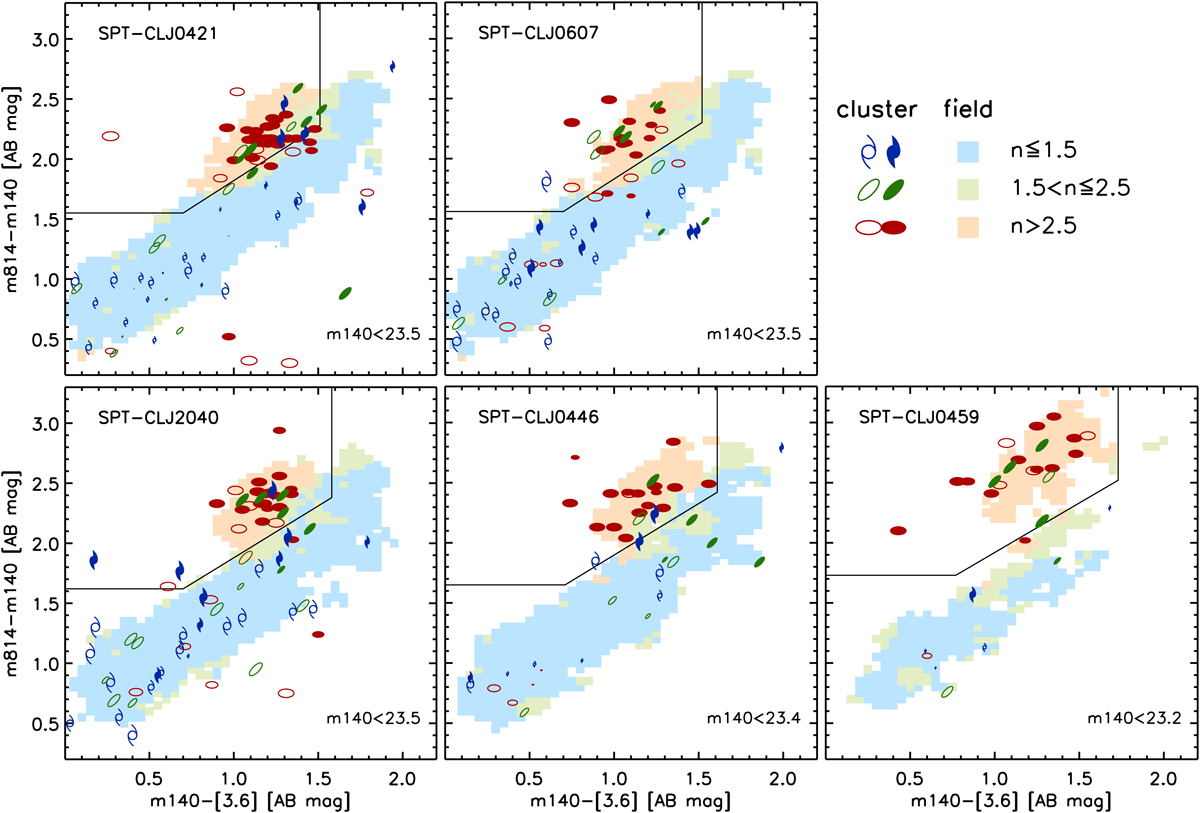
Fig. 1.
Download original image
Observed m814−m140 vs. m140−[3.6] colour-colour diagram of candidate cluster members at r/r500 < 0.7 for all clusters, down to the m140 limit indicated in each panel, coded by best-fit Sersic index as indicated in the legend (dark red, green and blue symbols). Filled and empty symbols show, respectively, galaxies above and below the stellar mass completeness limit for the individual cluster (Table 1). Symbol size scales with the statistical background-subtraction weight (Sect. 2.2.1; smaller symbols are overall more likely to be interlopers). In each panel, the black line marks the adopted separation between quiescent and star-forming galaxies, following S19. The background colour scale traces the median Sersic index (see legend) across the colour diagram (within a colour distance of 0.1 mag) of galaxies in the reference field sample with photo-zs within ±0.1 from the cluster’s redshift, and same m140 magnitude limit (only colour bins with at least five galaxies are shown).
Current usage metrics show cumulative count of Article Views (full-text article views including HTML views, PDF and ePub downloads, according to the available data) and Abstracts Views on Vision4Press platform.
Data correspond to usage on the plateform after 2015. The current usage metrics is available 48-96 hours after online publication and is updated daily on week days.
Initial download of the metrics may take a while.