Open Access
Fig. 2.
Download original image
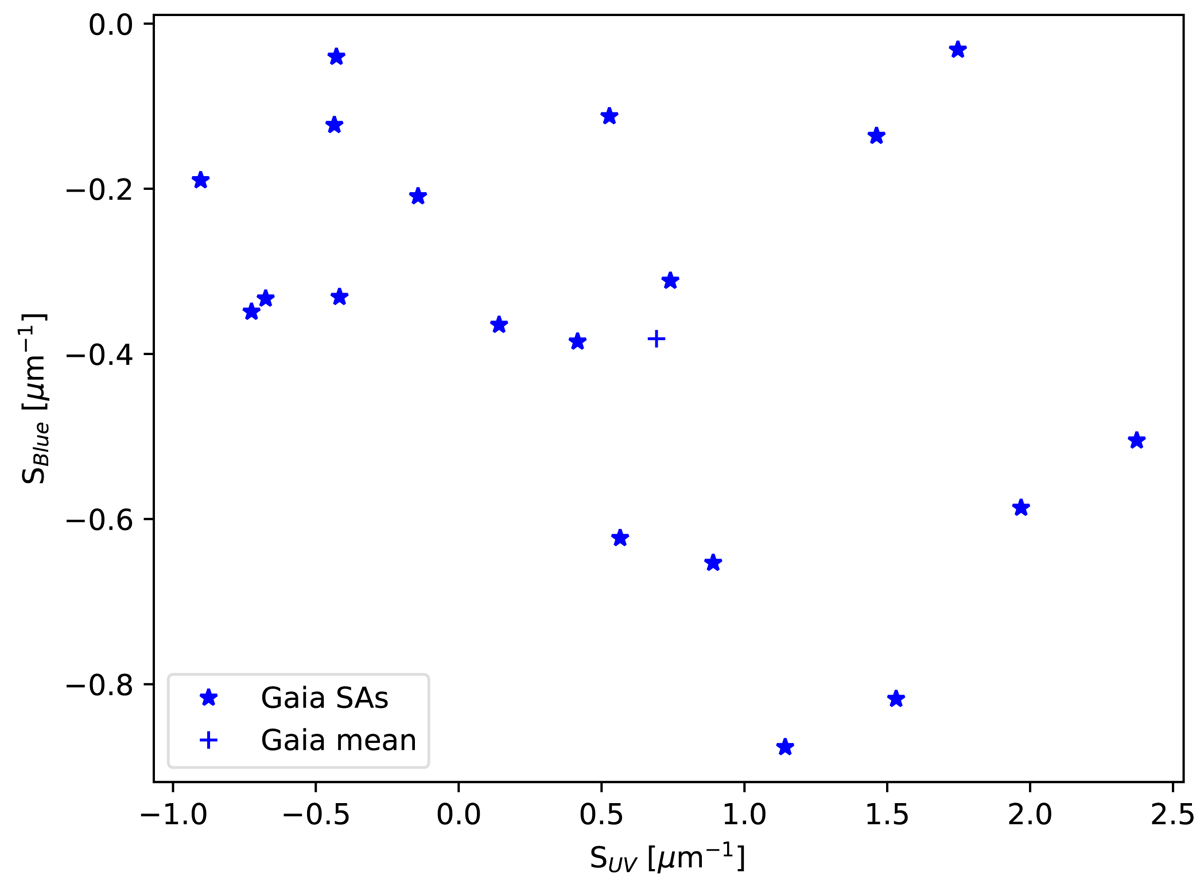
Slopes introduced by each of the SAs in the Gaia sample (blue stars) and their mean (blue cross), compared to Hyades 64. We note that SBlue was computed in the 0.4–0.55 μm range, while SUV was computed using wavelengths below 0.4 μm.
Current usage metrics show cumulative count of Article Views (full-text article views including HTML views, PDF and ePub downloads, according to the available data) and Abstracts Views on Vision4Press platform.
Data correspond to usage on the plateform after 2015. The current usage metrics is available 48-96 hours after online publication and is updated daily on week days.
Initial download of the metrics may take a while.