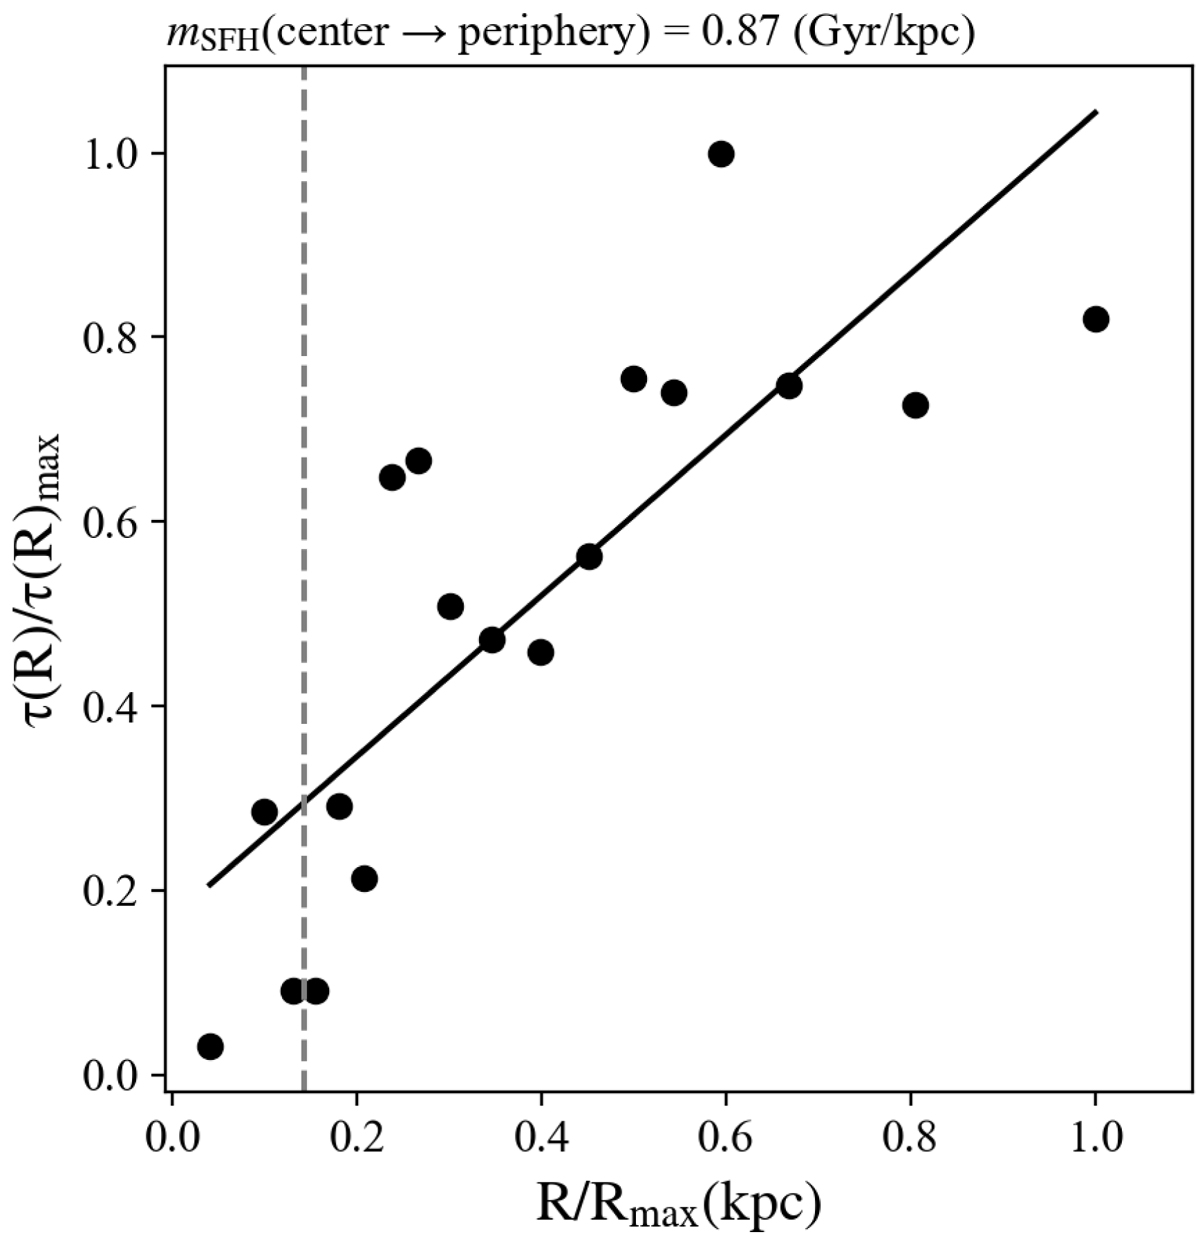
Fig. 9.
Download original image
Radial evolution of the best-fitting τ illustrating the nature of the SFHs of the individual zones (early collapse vs. continuous mass assembly) for UGC 12250. A linear fit was performed, which slope depicts how steeply the observed SFHs evolve, from the centre to the periphery of the galaxy. A grey vertical line indicates the isophotal radius of the bulge, comprising 3 isan. Over the figure it is provided the value of the estimated slope.
Current usage metrics show cumulative count of Article Views (full-text article views including HTML views, PDF and ePub downloads, according to the available data) and Abstracts Views on Vision4Press platform.
Data correspond to usage on the plateform after 2015. The current usage metrics is available 48-96 hours after online publication and is updated daily on week days.
Initial download of the metrics may take a while.