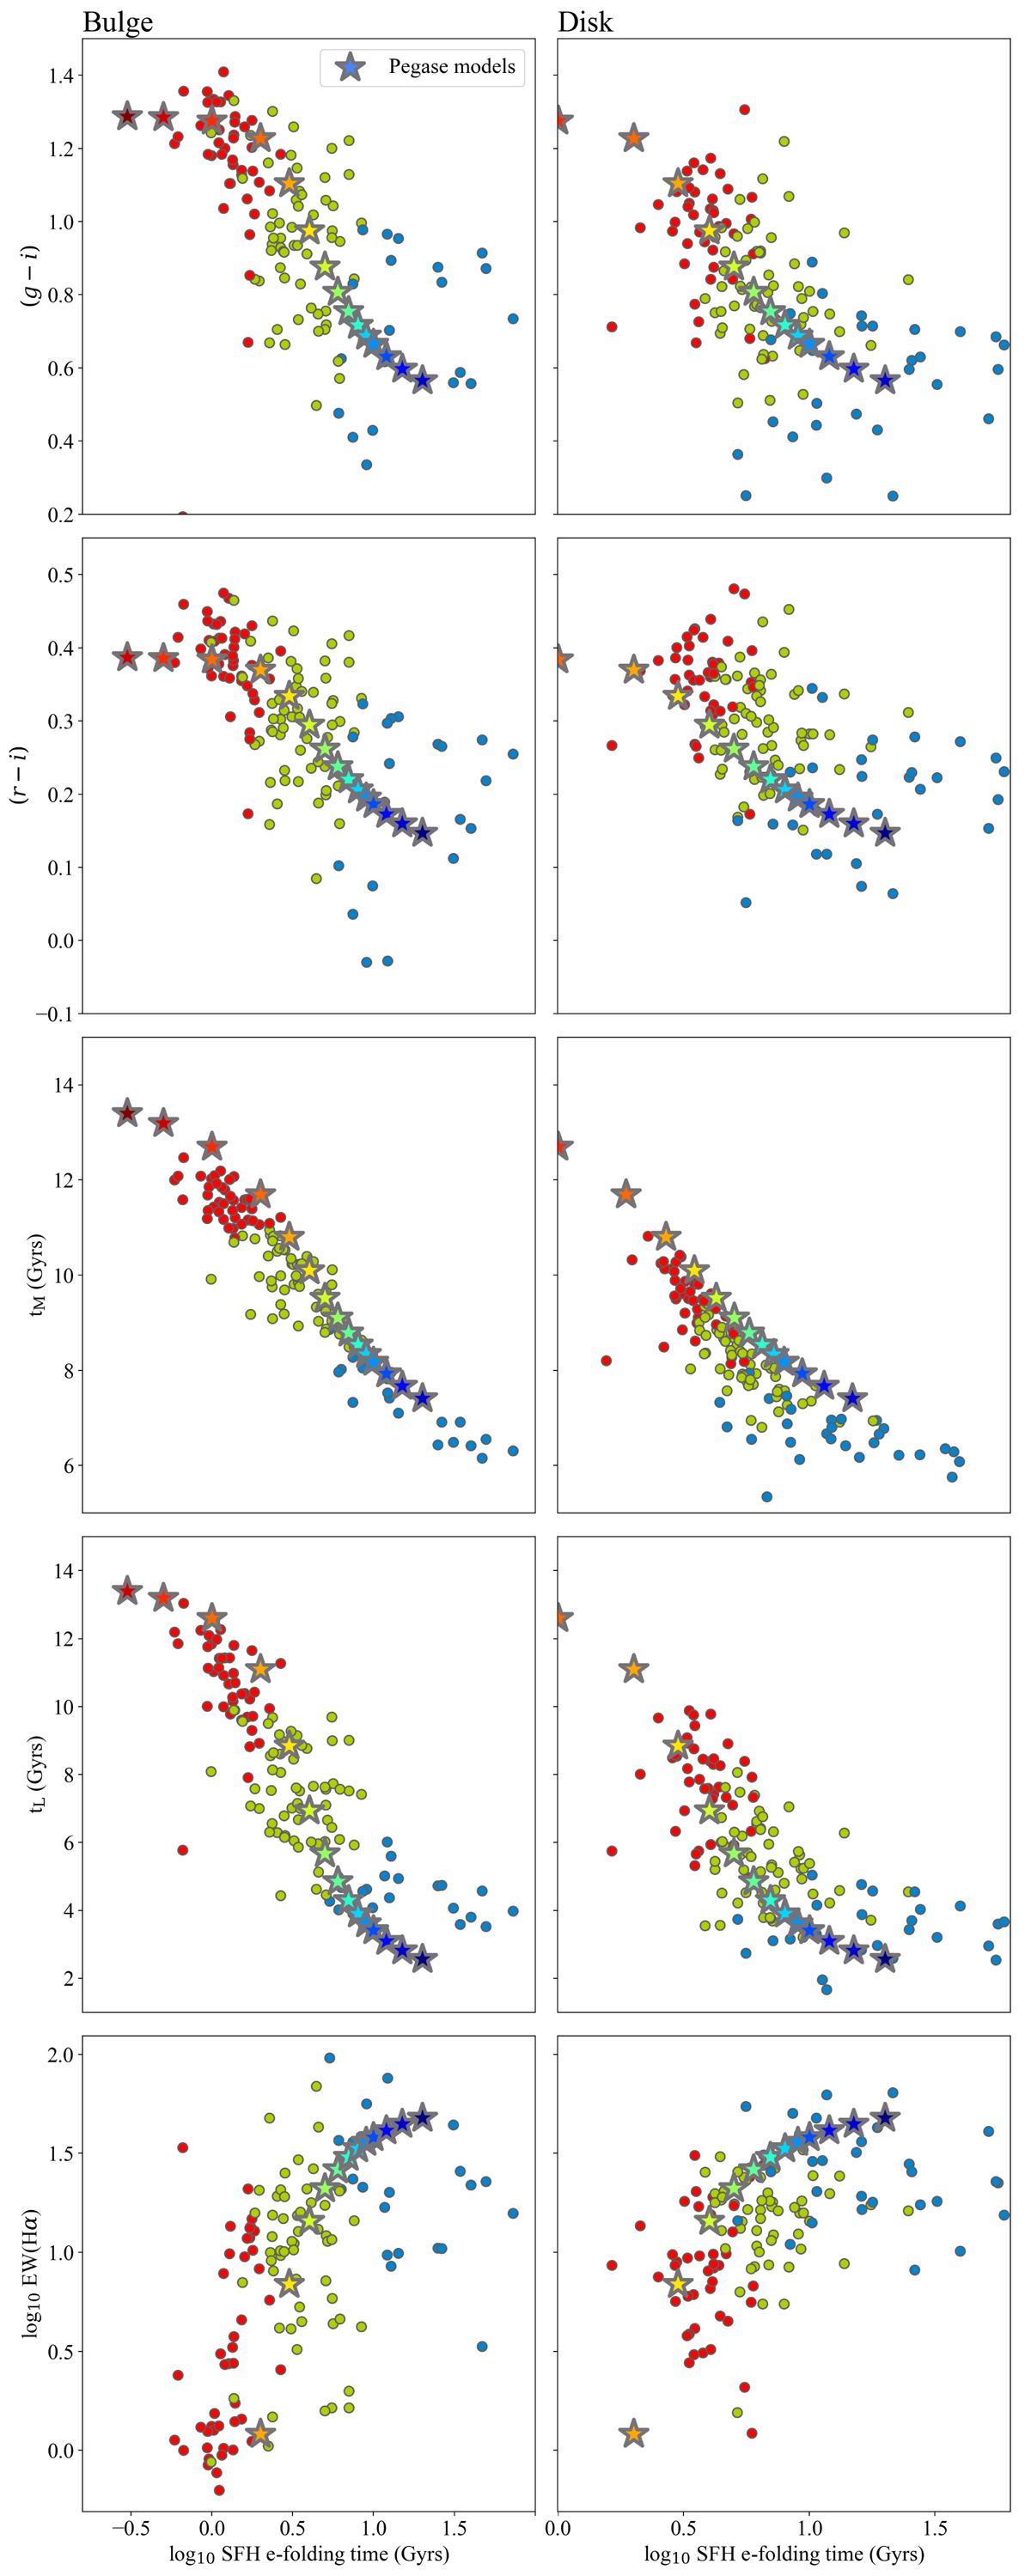
Fig. 6.
Download original image
Logarithm of the estimated τ for the sample bulges (left-hand side) and disks (right-hand side) vs. observed optical colours (g − i in the first row and r − i in second) after correction from intrinsic extinction effects, mean stellar age (mass-weighted in the third row and luminosity-weighted in the fourth), and EW(Hα) in the fifth row. Observations (defined by the circles) are contrasted with the model predictions (illustrated by the stars).
Current usage metrics show cumulative count of Article Views (full-text article views including HTML views, PDF and ePub downloads, according to the available data) and Abstracts Views on Vision4Press platform.
Data correspond to usage on the plateform after 2015. The current usage metrics is available 48-96 hours after online publication and is updated daily on week days.
Initial download of the metrics may take a while.