Fig. 5.
Download original image
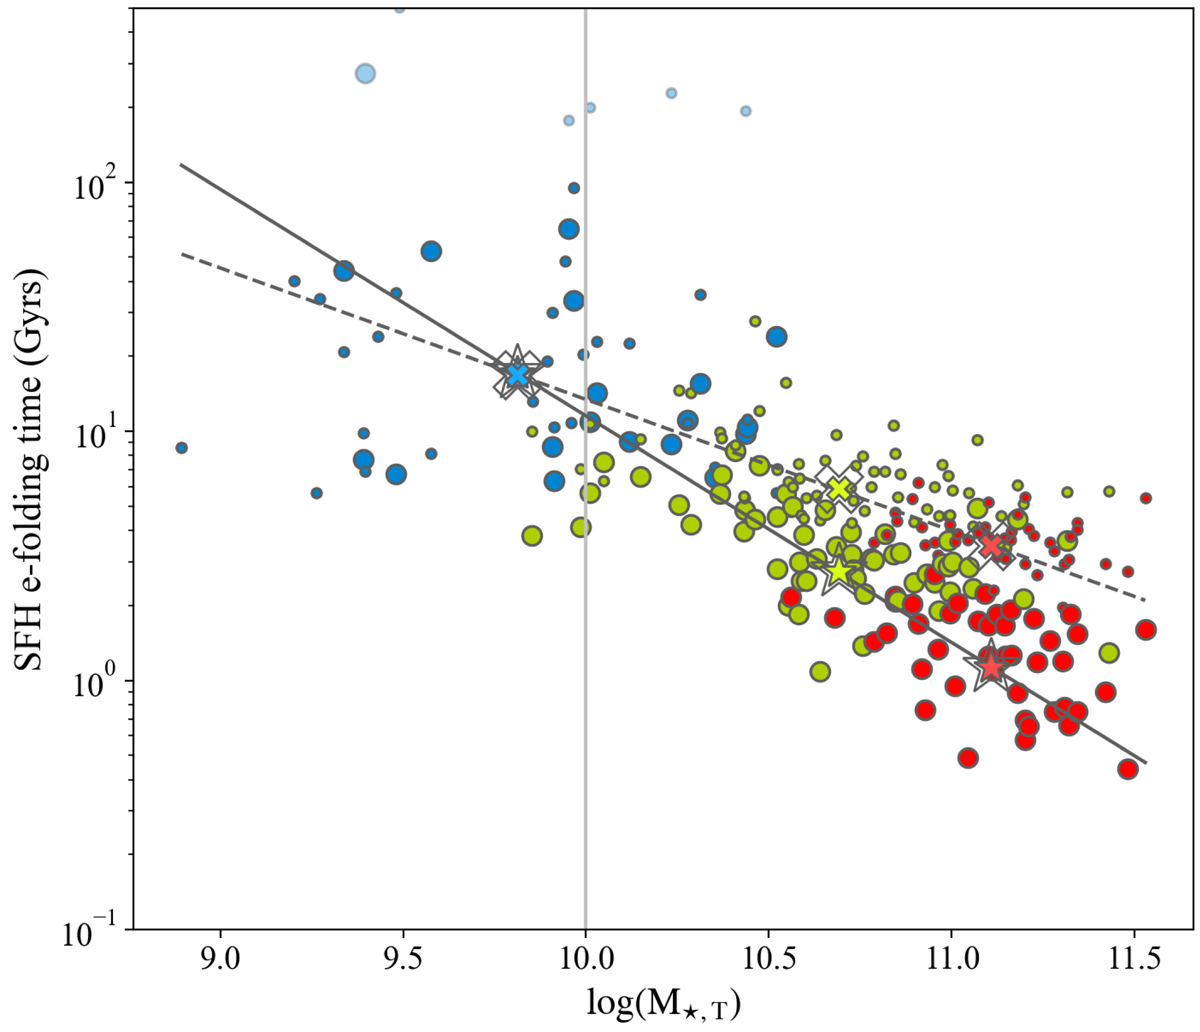
e-folding time of the SFH of both bulges and disks over the total present-day galaxy mass. Linear relations for both stellar components are over-plotted (solid lines for the bulge, dashed lines for the disk). The marks are colour coded according to their ⟨δμ9G⟩ interval (iA blue, iB green, iC red) and their size represents the measurements for bulge and disk (bigger and smaller circles, respectively). Average estimates for the e-folding times for both bulges and disks within each class are indicated by the coloured crosses and stars symbols, respectively. Transparent data points depict poor fits to the SFH distribution and are not considered in the linear fits.
Current usage metrics show cumulative count of Article Views (full-text article views including HTML views, PDF and ePub downloads, according to the available data) and Abstracts Views on Vision4Press platform.
Data correspond to usage on the plateform after 2015. The current usage metrics is available 48-96 hours after online publication and is updated daily on week days.
Initial download of the metrics may take a while.