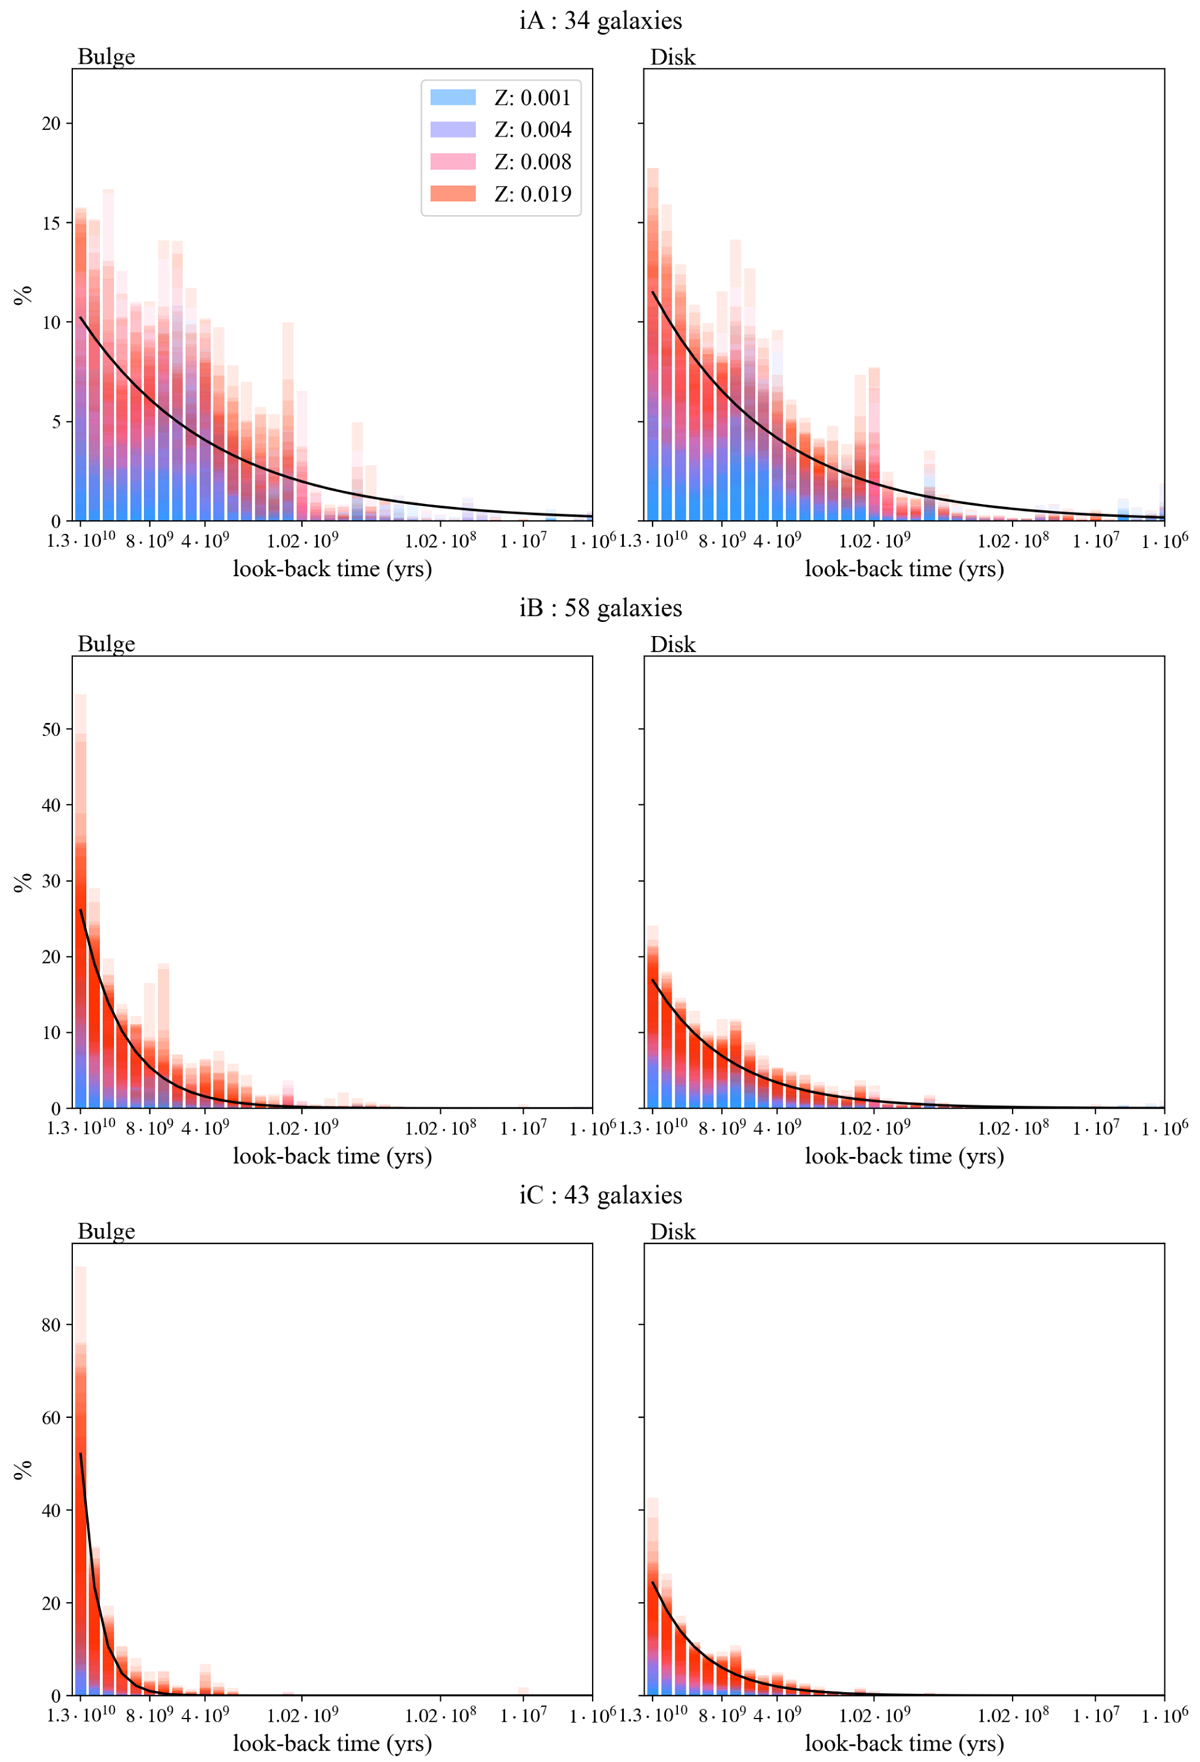
Fig. 2.
Download original image
Series of histograms depicting the mass assembly through time (of old stars ever-formed stellar mass vs. lookback time) of bulges (left-hand side) and disks (right-hand side) of the three ⟨δμ9G⟩ intervals (iA, iB and iC, from top to bottom). The histograms refer to the total stellar mass ever formed, not being corrected from the mass returned into the ISM through SNe and stellar winds. In addition, the histograms result from the combination of the mass assembly histories of all galaxies appertaining to each interval. It is colour coded according to the metallicity of each stellar population, as indicated by the legend.
Current usage metrics show cumulative count of Article Views (full-text article views including HTML views, PDF and ePub downloads, according to the available data) and Abstracts Views on Vision4Press platform.
Data correspond to usage on the plateform after 2015. The current usage metrics is available 48-96 hours after online publication and is updated daily on week days.
Initial download of the metrics may take a while.