Fig. 1.
Download original image
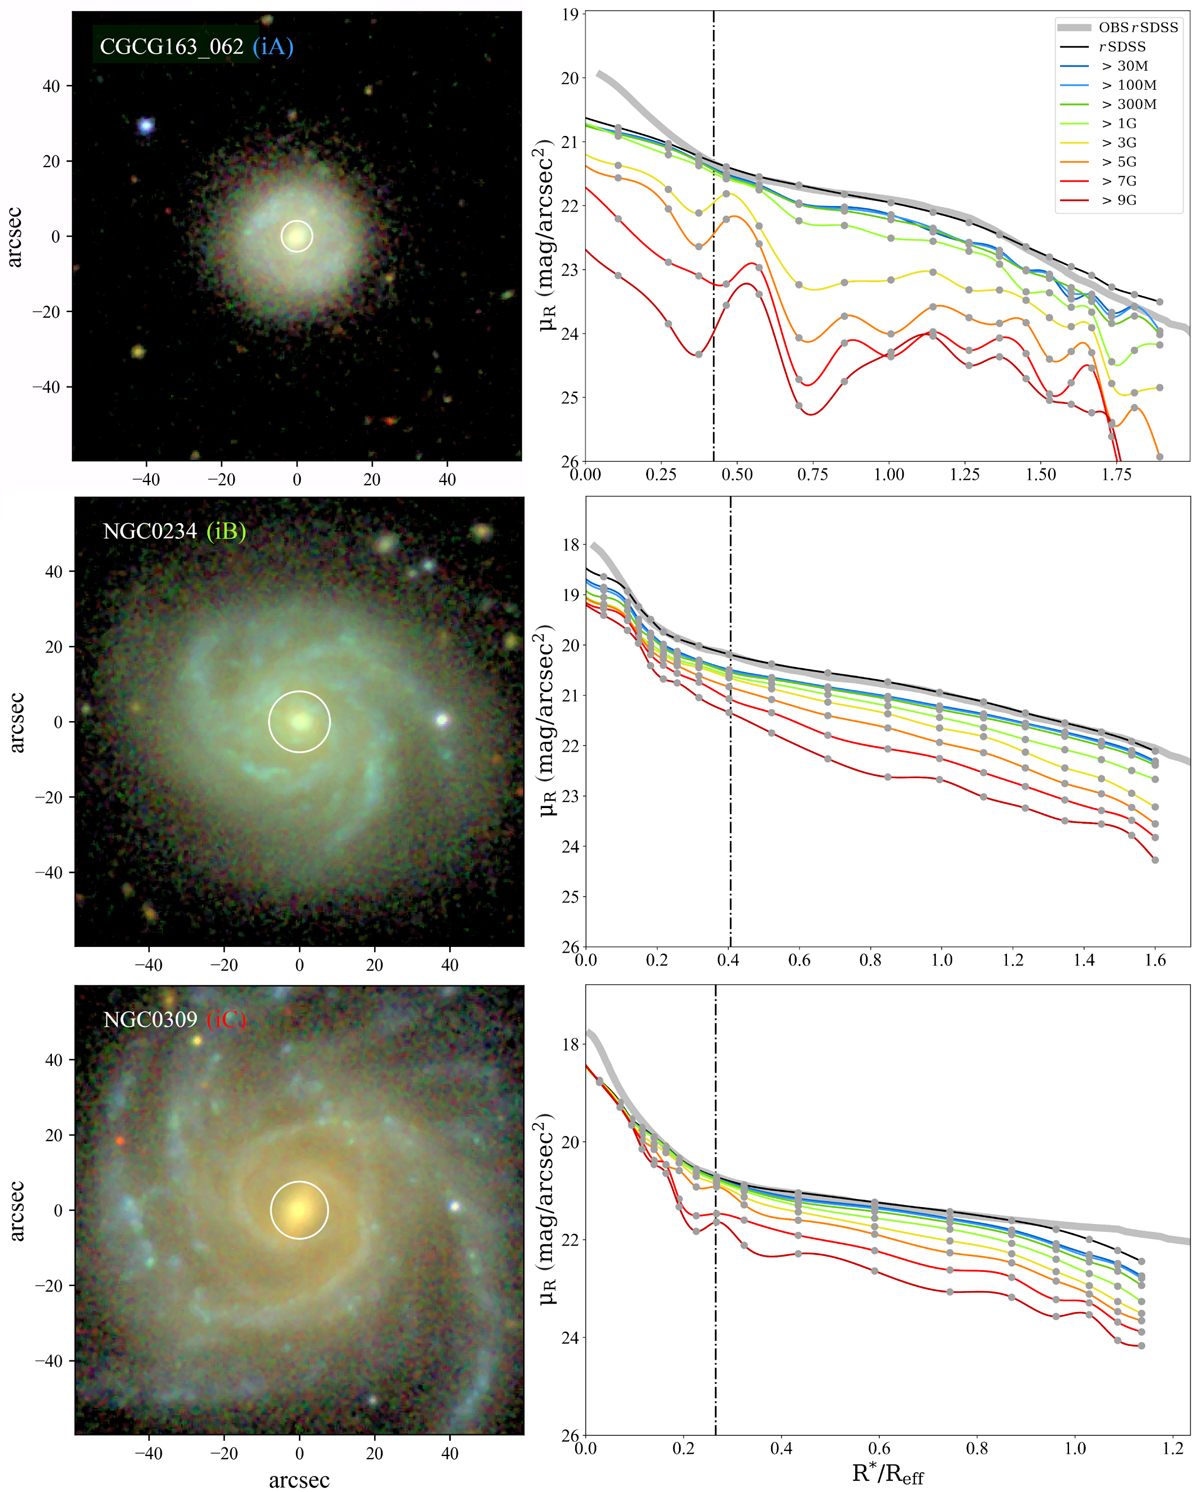
SDSS true-colour images and respective SBPs for three exemplary LTGs, demonstrating the morphological differences of the three ⟨δμ9G⟩ intervals tentatively defined in BP18. The synthetic SBPs were computed by convolving the observed IFS data with the SDSS r-band filter transmission curve after removal with ℛ𝒴 of stellar populations younger than 0.03, 0.1, 0.3, 1, 3, 5, 7, and 9 Gyr, being colour coded according to the age they represent. Shown in grey is the r-band SBP extracted from the SDSS photometric data. The vertical dashed line illustrates the estimated isophotal bulge radius ℛB, depicted in the true colour image by a while circle.
Current usage metrics show cumulative count of Article Views (full-text article views including HTML views, PDF and ePub downloads, according to the available data) and Abstracts Views on Vision4Press platform.
Data correspond to usage on the plateform after 2015. The current usage metrics is available 48-96 hours after online publication and is updated daily on week days.
Initial download of the metrics may take a while.