Fig. 9.
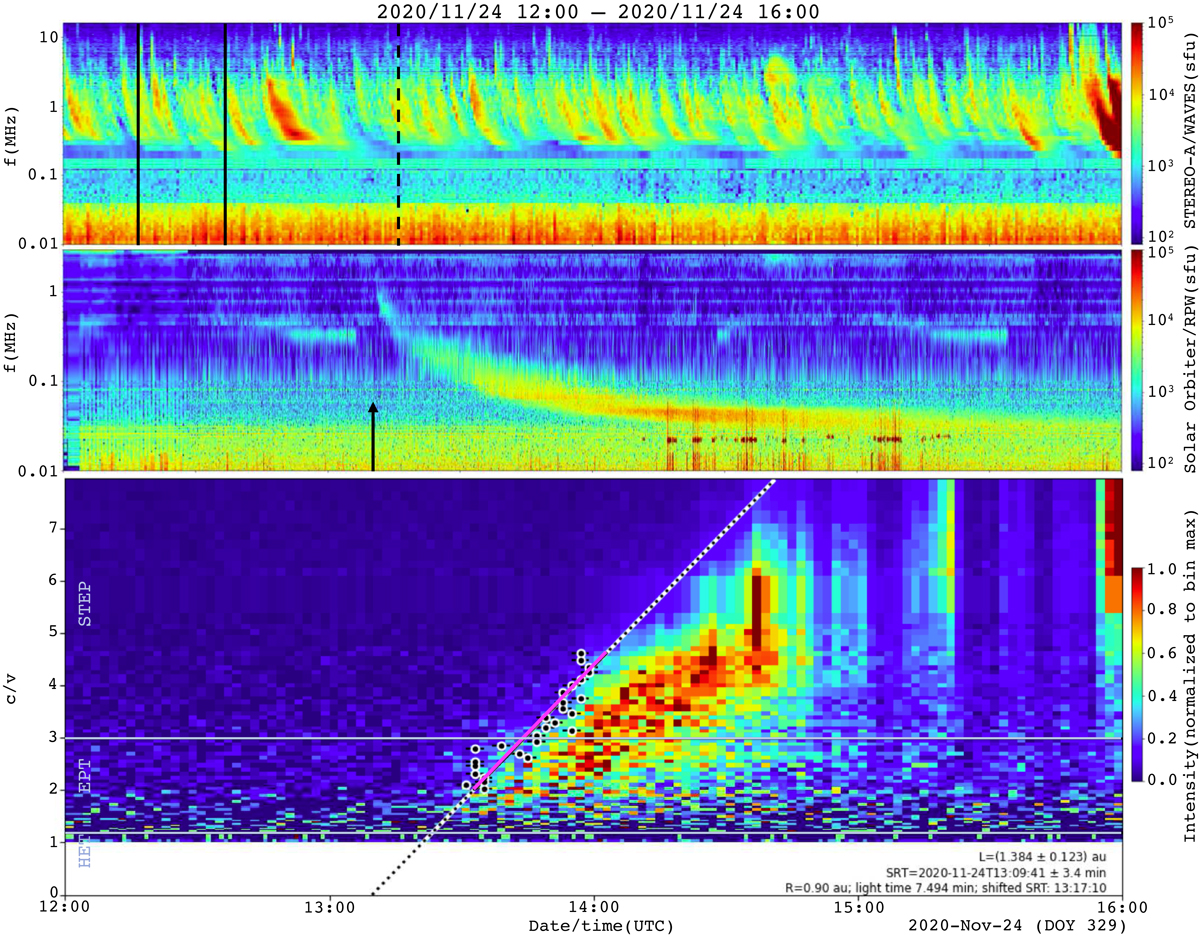
Download original image
Radio and electron spectrograms. Top: STEREO-A WAVES and (middle) Solar Orbiter RPW radio spectrograms with times shifted to the Sun. The two vertical solid lines mark the start of the CME and jet-like eruptions in EUVI, respectively. The vertical dashed line marks the first appearance of the CME in COR2. The arrow marks the onset of the type III radio bursts at 13:18 UT observed by Solar Orbiter. We note that all vertical lines in the top panel and the arrow in the middle panel mark times shifted to the Sun. Bottom: electron c/v vs. time plot, where c is the speed of light and v is the electron velocity. The slanted line is a linear fit to the electron arrival times; the solid part of the line marks the energy range used for the fit. Gray horizontal lines separate the STEP, EPT, and HET energy ranges.
Current usage metrics show cumulative count of Article Views (full-text article views including HTML views, PDF and ePub downloads, according to the available data) and Abstracts Views on Vision4Press platform.
Data correspond to usage on the plateform after 2015. The current usage metrics is available 48-96 hours after online publication and is updated daily on week days.
Initial download of the metrics may take a while.