Fig. 5.
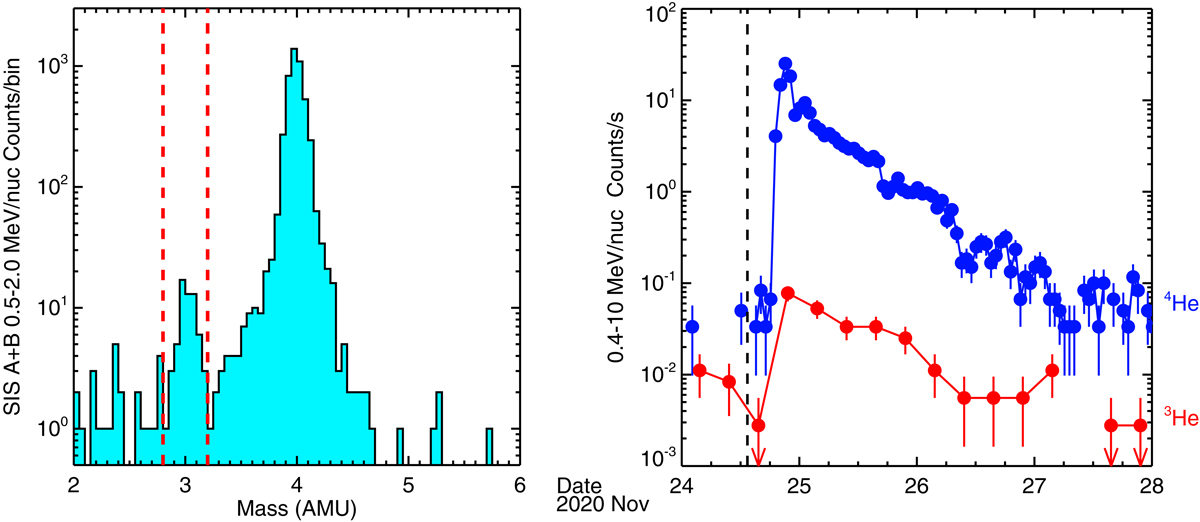
Download original image
3He mass peak and comparison of 3He and 4He counts s−1 time profiles. Left: He mass histogram from the two SIS telescopes A and B for 2020 November 24 12:00 UT–2020 November 27 00:00 UT and energy range of 0.5–2.0 MeV nucleon−1. The vertical dashed red lines mark the mass range for 3He count rates shown in the right panel. Right: SIS 1 h 4He and 6 h 3He count rates at 0.4–10 MeV nucleon−1. The vertical dashed black line indicates the first appearance of the CME in the coronagraph.
Current usage metrics show cumulative count of Article Views (full-text article views including HTML views, PDF and ePub downloads, according to the available data) and Abstracts Views on Vision4Press platform.
Data correspond to usage on the plateform after 2015. The current usage metrics is available 48-96 hours after online publication and is updated daily on week days.
Initial download of the metrics may take a while.