Fig. 3.
Download original image
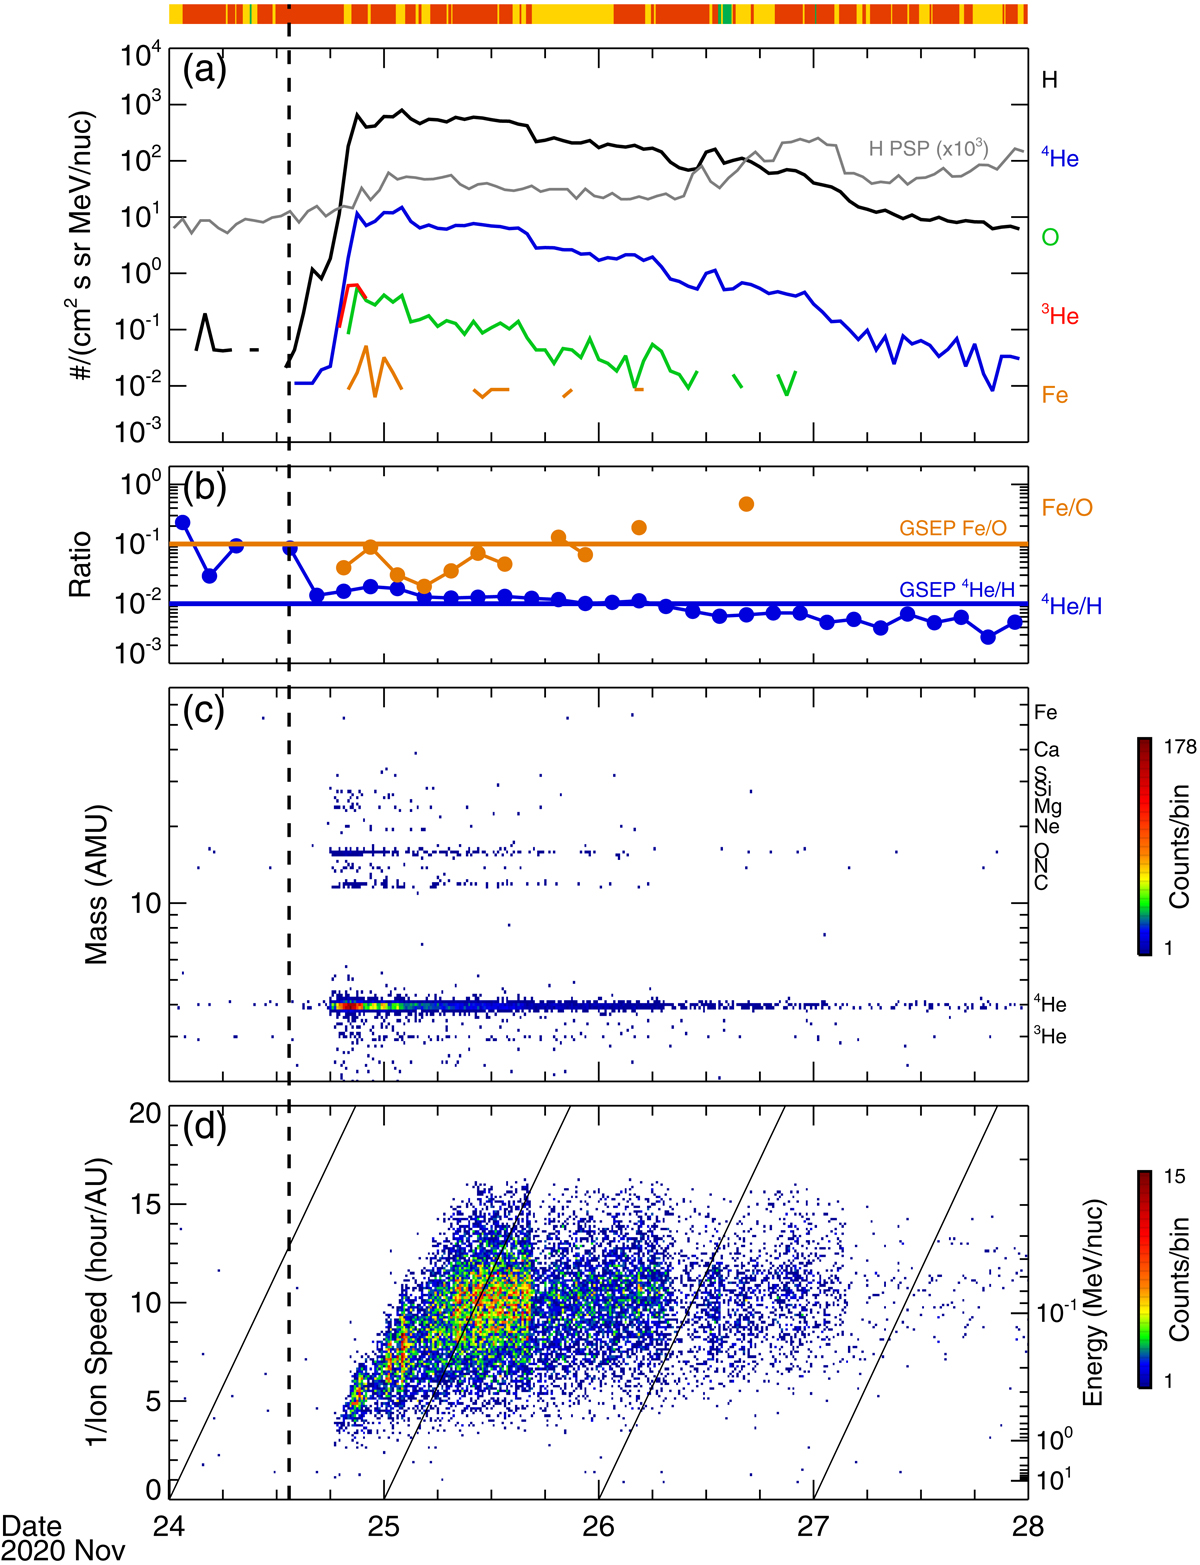
GSEP event with time profiles of various physical quantities. (a) Solar Orbiter SIS 1 hr H, 3He, 4He, O, and Fe intensity at 0.23–0.32 MeV nucleon−1. The H PSP curve is a combination of 1 hr H count rates (s−1) from 14 energy bins between 0.023 MeV and 0.187 MeV from PSP IS⊙IS EPI-Lo. (b) Solar Orbiter SIS 3 h 4He/H and Fe/O ratios at 0.23–0.32 MeV nucleon−1. The horizontal lines mark 4He/H and Fe/O in GSEP events (Reames 1995). (c) Solar Orbiter SIS mass vs. time at 0.4–10 MeV nucleon−1. (d) Solar Orbiter SIS 1/(ion speed) vs. arrival times of 10–70 AMU ions. The measurements are from both SIS telescopes and averaged together. The vertical dashed line indicates the first appearance of the CME in the STEREO-A/COR2 coronagraph. Sloped lines mark arrival times for particles traveling along the nominal Parker field line without scattering. The horizontal color bar on the top shows IMF polarity at Solar Orbiter. Red is negative, green is positive, and yellow is an ambiguous polarity.
Current usage metrics show cumulative count of Article Views (full-text article views including HTML views, PDF and ePub downloads, according to the available data) and Abstracts Views on Vision4Press platform.
Data correspond to usage on the plateform after 2015. The current usage metrics is available 48-96 hours after online publication and is updated daily on week days.
Initial download of the metrics may take a while.