Fig. 1.
Download original image
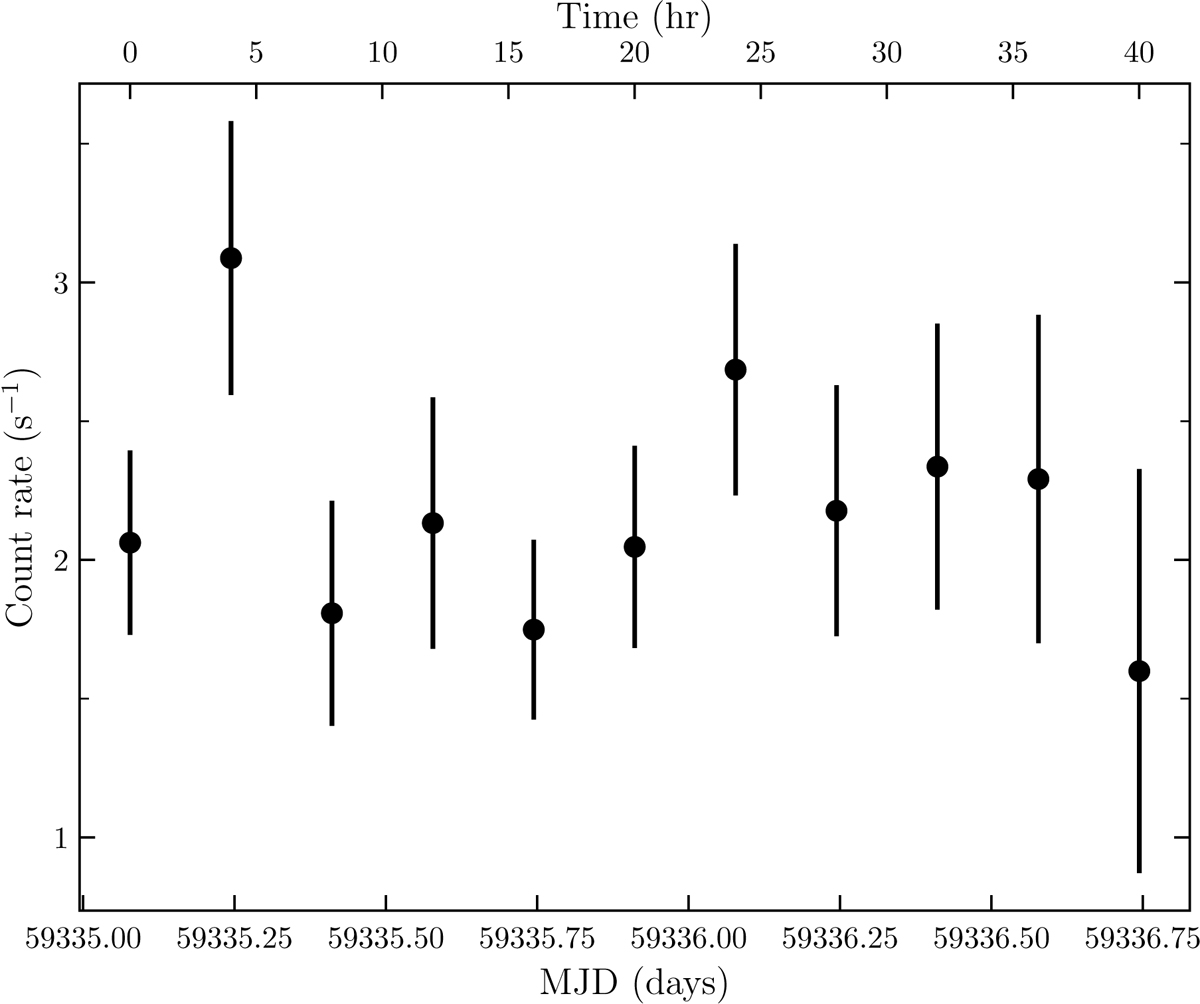
Background-subtracted eROSITA light curve of eRASSt J040515.6 − 745202 during eRASS3 in the energy band 0.2–8.0 keV. Each data point represents one scan with a typical duration of 40 s and combines data from all seven cameras. The count rates were corrected for vignetting and point-spread function losses. The time in hours starts at the beginning of the first scan.
Current usage metrics show cumulative count of Article Views (full-text article views including HTML views, PDF and ePub downloads, according to the available data) and Abstracts Views on Vision4Press platform.
Data correspond to usage on the plateform after 2015. The current usage metrics is available 48-96 hours after online publication and is updated daily on week days.
Initial download of the metrics may take a while.