Open Access
Fig. 8
Download original image
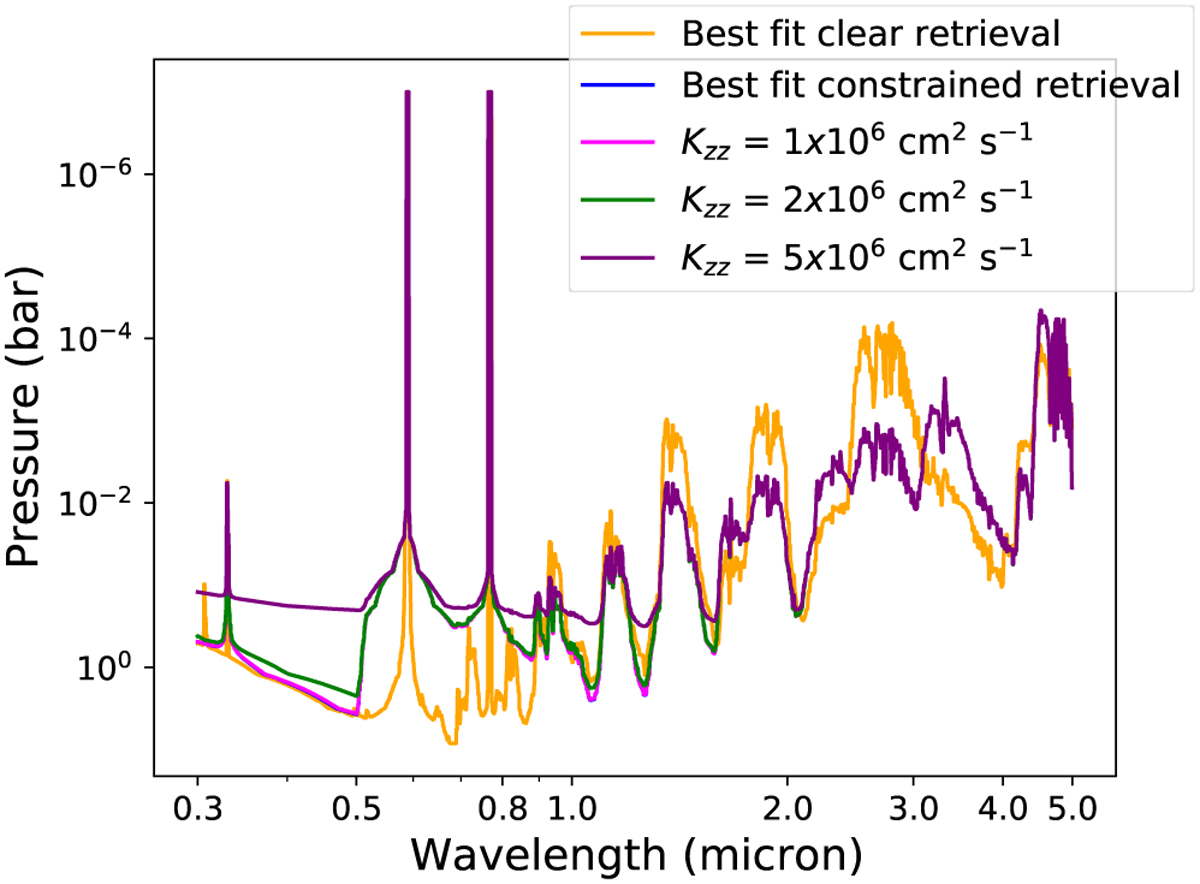
Same cloud formation setups with varying cloud diffusivity Kzz as for Fig. 7, but this time showing the pressure levels at which optical depth τ reaches unity, as a function of wavelength. The sharp drop in the Na lines (green line) is artificial and caused by the cutoff in the available opacity data.
Current usage metrics show cumulative count of Article Views (full-text article views including HTML views, PDF and ePub downloads, according to the available data) and Abstracts Views on Vision4Press platform.
Data correspond to usage on the plateform after 2015. The current usage metrics is available 48-96 hours after online publication and is updated daily on week days.
Initial download of the metrics may take a while.