Fig. 5
Download original image
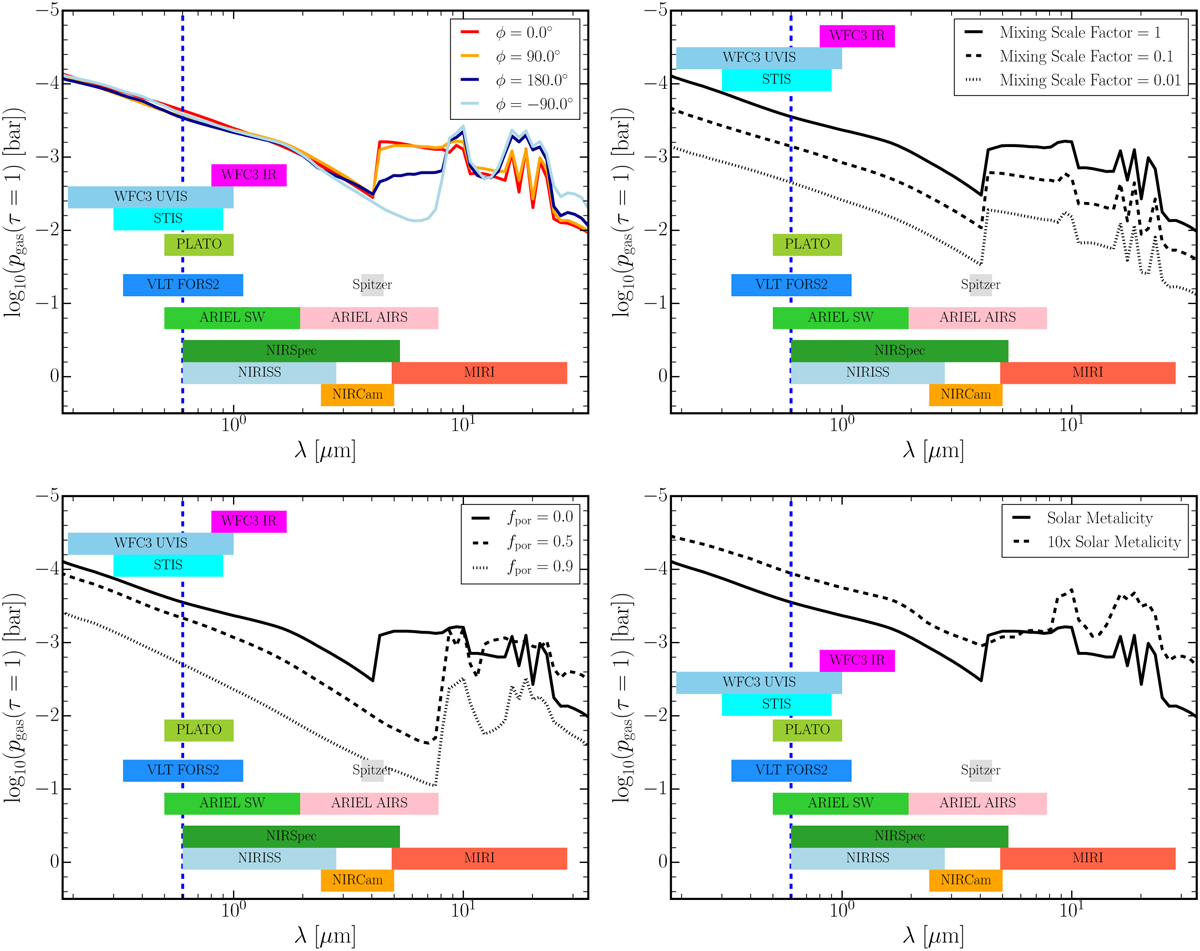
Changing slope of the optically thick pressure levels (pgas(τ(λ) = 1) within optical to mid-IR wavelengths (0.2−30 μm). The dashed blue line indicates the location of the sodium line, and the coloured bars show the wavelength ranges of various missions. Top left: τ(λ) = 1 slopes for the morning and evening terminator, the substellar point (ϕ = 0°, red), and the antistellar point (ϕ = 180°, dark blue). The remaining plots show parameter studies for the evening terminator (ϕ = 90°, θ = 0°). Top right: different mixing efficiencies. Bottom left: effect of cloud particle porosity. Bottom right: effect of element abundances.
Current usage metrics show cumulative count of Article Views (full-text article views including HTML views, PDF and ePub downloads, according to the available data) and Abstracts Views on Vision4Press platform.
Data correspond to usage on the plateform after 2015. The current usage metrics is available 48-96 hours after online publication and is updated daily on week days.
Initial download of the metrics may take a while.