Fig. 1
Download original image
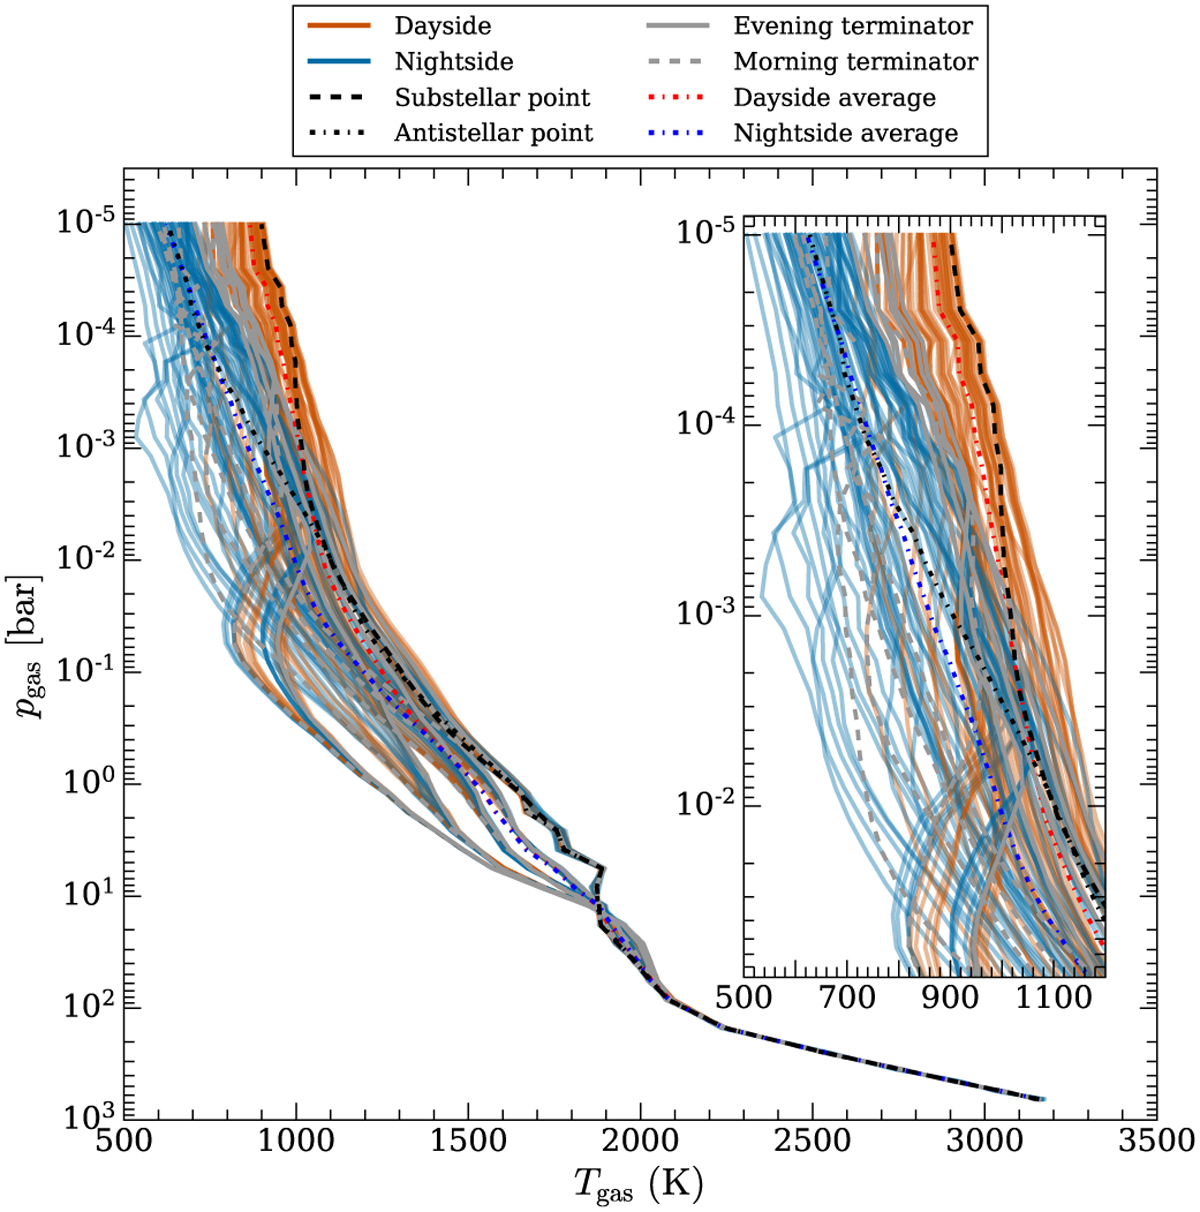
Pressure-temperature structure of the 120 1D profiles extracted from the GCM results. Orange lines represent the dayside profiles, blue lines show the nightside profiles, and the grey lines show the terminator profiles. Dashed and dot-dashed black lines highlight the substellar and antistellar points respectively. Day- and nightside hemisphere averages are shown as dashed red and blue lines. The inset shows the upper atmosphere GCM of the profiles.
Current usage metrics show cumulative count of Article Views (full-text article views including HTML views, PDF and ePub downloads, according to the available data) and Abstracts Views on Vision4Press platform.
Data correspond to usage on the plateform after 2015. The current usage metrics is available 48-96 hours after online publication and is updated daily on week days.
Initial download of the metrics may take a while.