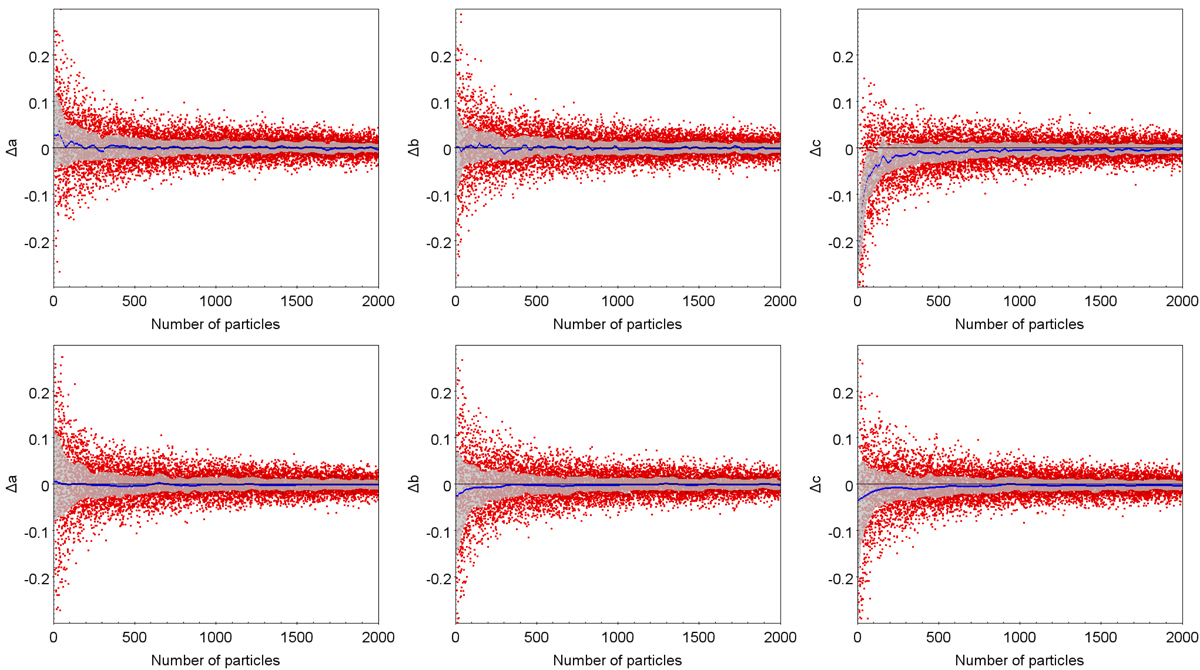
Fig. A.1.
Download original image
Analysis of 10 000 simulated halos. Relative difference (Δa, Δb, Δc) in the recovered semi-axes (a,b,c) as a function of the number of particles of (upper panel) quasi-spherical halos with csim/asim = 0.72 and (lower panel) flattened halos with csim/asim = 0.25. Blue lines indicate the median of the distributions and the grey area shows the quartiles.
Current usage metrics show cumulative count of Article Views (full-text article views including HTML views, PDF and ePub downloads, according to the available data) and Abstracts Views on Vision4Press platform.
Data correspond to usage on the plateform after 2015. The current usage metrics is available 48-96 hours after online publication and is updated daily on week days.
Initial download of the metrics may take a while.