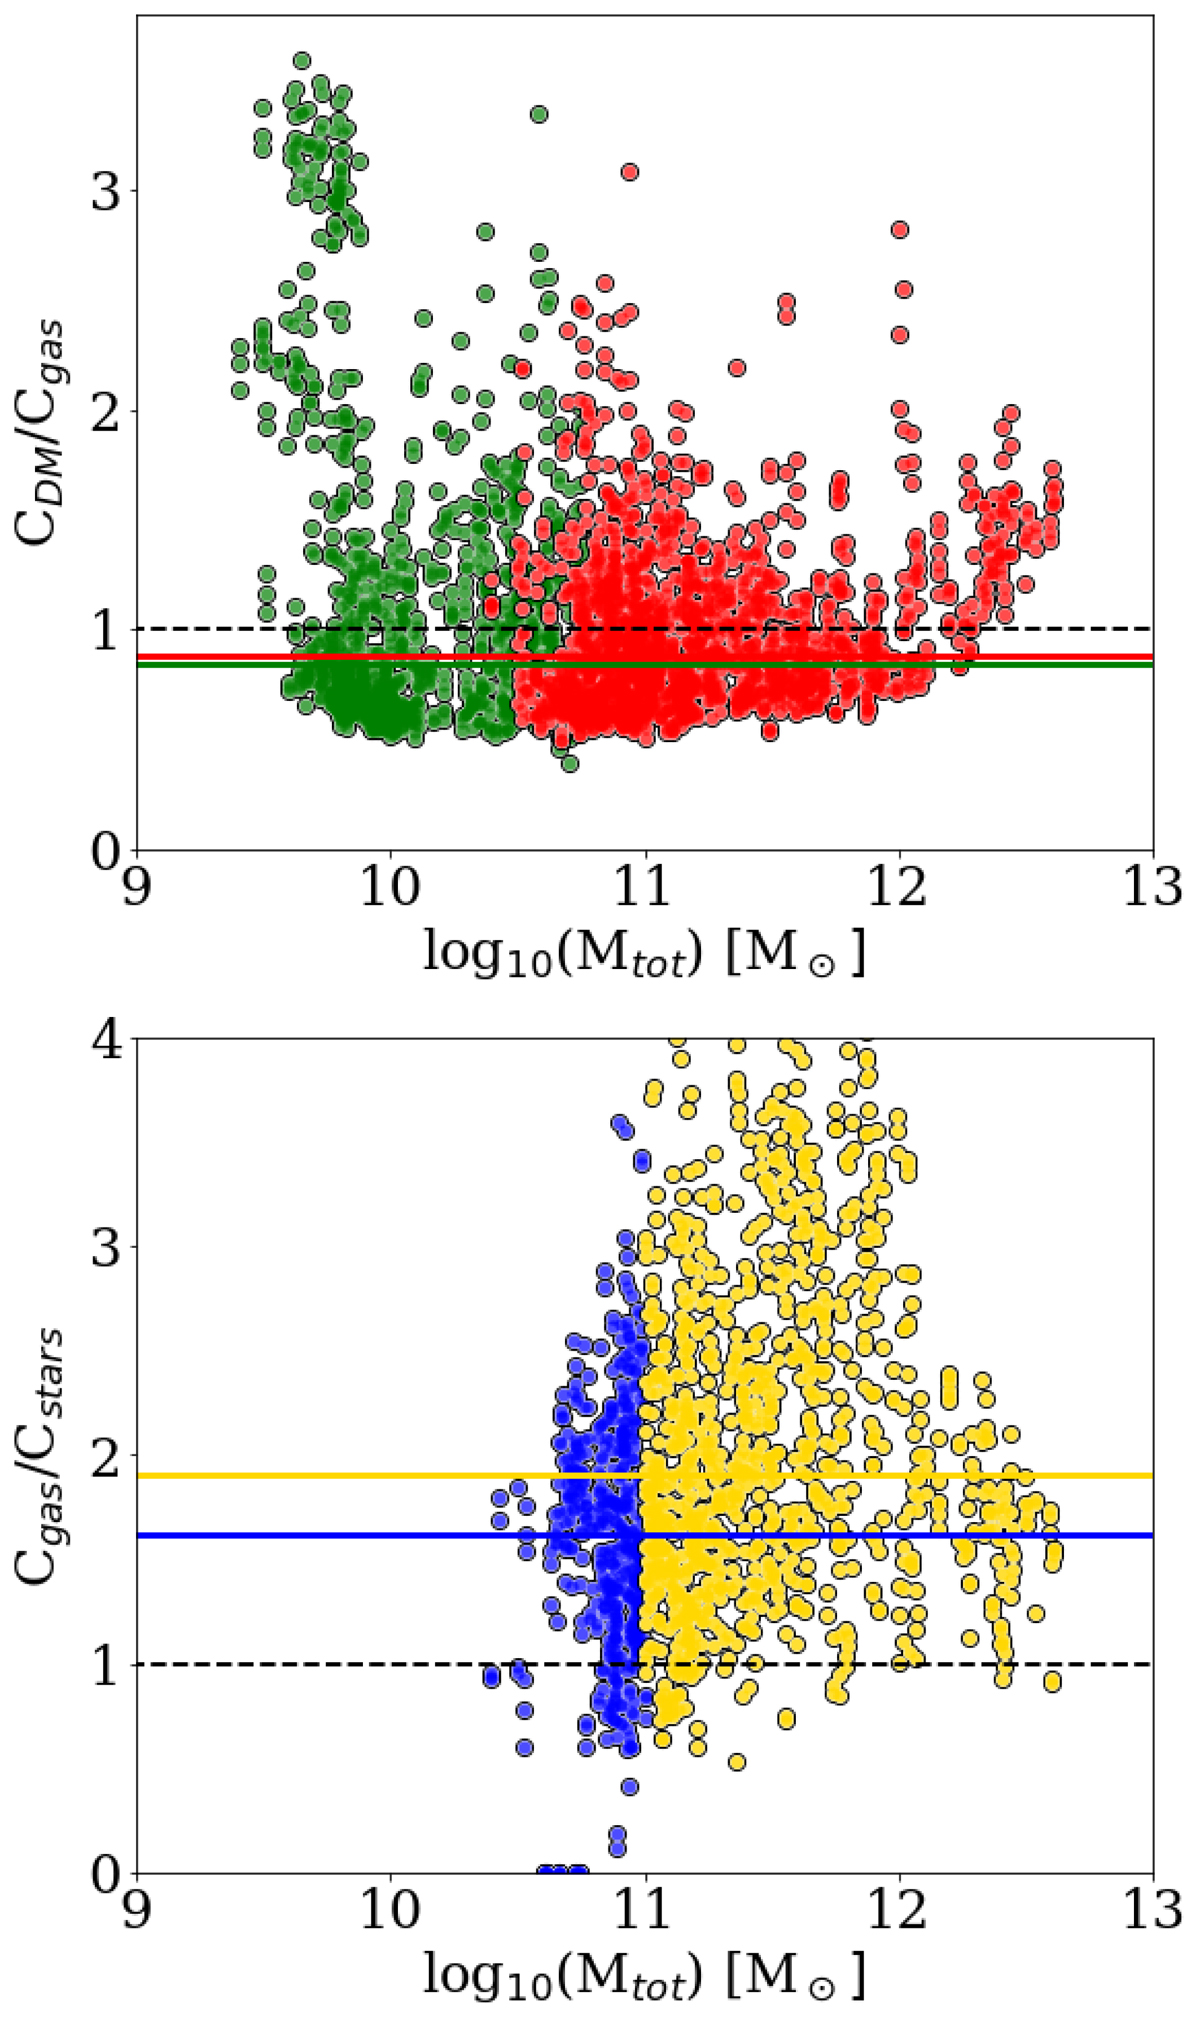
Fig. 17.
Download original image
Concentration ratio of the projected halos at z = 0.5 from the RefL0025N0376 simulation. The halos have a minimum of 200 particles. The ratios CDM/Cgas (top panel) and Cgas/Cstars (bottom panel) are expressed as a function of the total mass of the halo. Gas halos are split in two groups, gas halos w/o stars (1290) in green and gas halos w/ stars (1875) in red. Star halos are split into two groups of approximately equal size: low mass halos (Mtot < 1011 M⊙), depicted by blue dots, and high mass halos (Mtot > 1011 M⊙), depicted by yellow dots. Colour lines represent the median. The constant dashed lines CDM/Cgas = 14 and Rgas/Rstars = 1 are also plotted as references.
Current usage metrics show cumulative count of Article Views (full-text article views including HTML views, PDF and ePub downloads, according to the available data) and Abstracts Views on Vision4Press platform.
Data correspond to usage on the plateform after 2015. The current usage metrics is available 48-96 hours after online publication and is updated daily on week days.
Initial download of the metrics may take a while.